
Number Chart - Definition, Examples, Quiz, FAQ, Trivia
Learn to count, skip count, and discover patterns with visual number charts
What is a Number Chart?
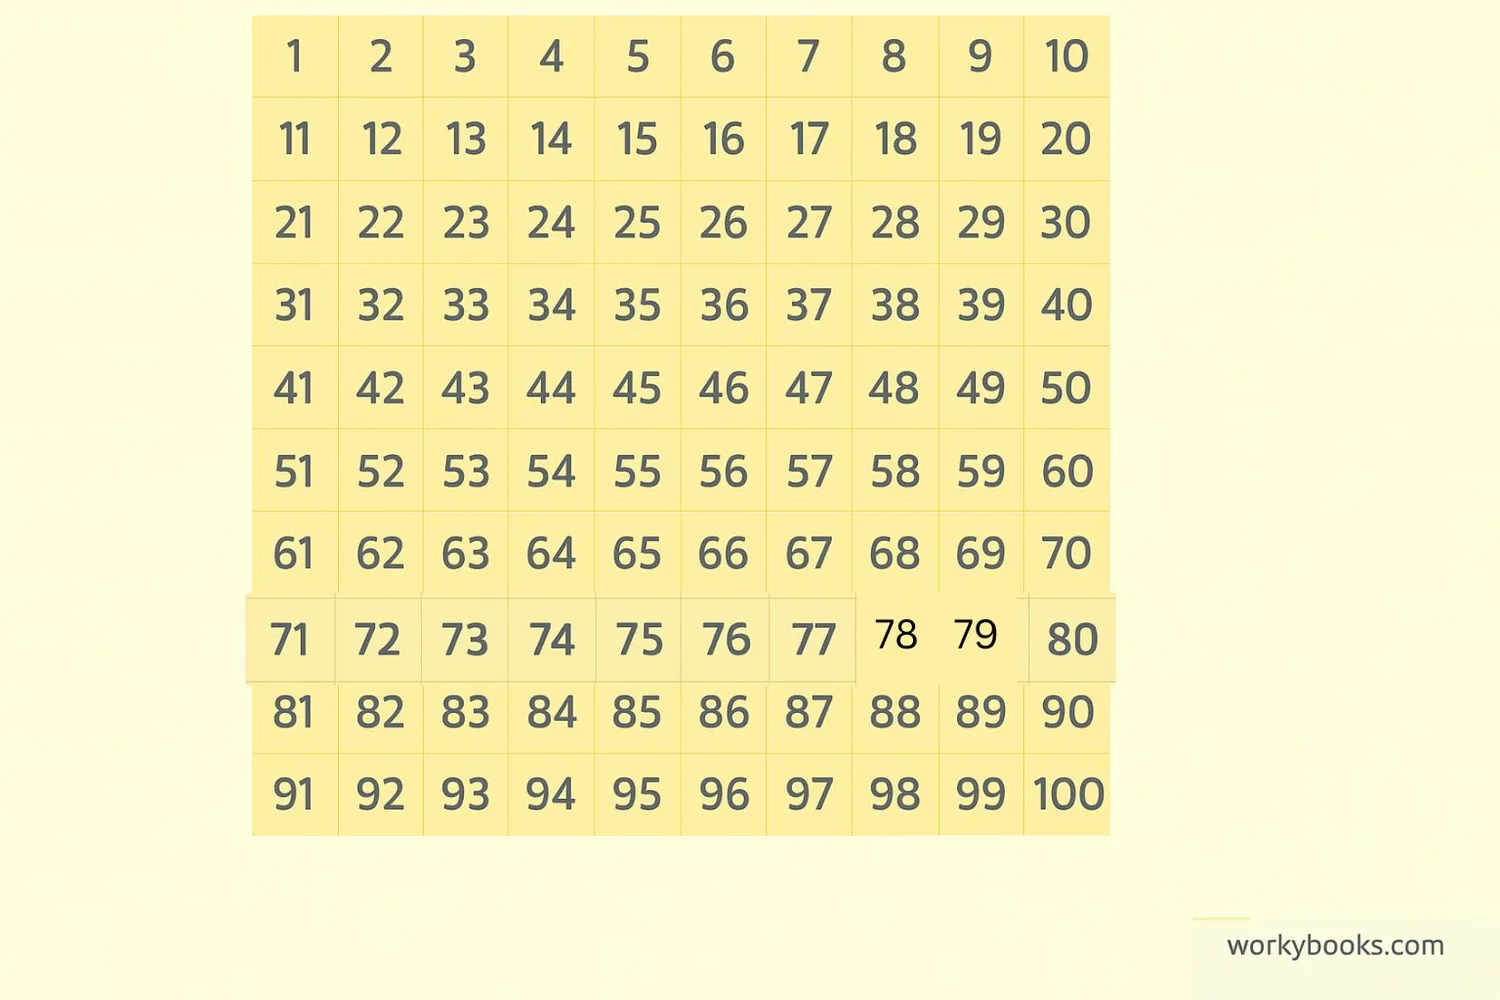
A number chart is a visual tool that displays numbers in an organized grid. It helps us see patterns and relationships between numbers. The most common number chart is the hundreds chart that shows numbers from 1 to 100 in rows of ten.
Number charts help students learn counting, skip counting, addition, subtraction, multiplication, and number patterns. By seeing numbers organized in rows and columns, we can easily find relationships between them.
Key features of number charts:
- Numbers are arranged in sequential order
- Each row typically has 10 numbers
- Moving down increases by 10 (from 1 to 11, 2 to 12, etc.)
- Moving right increases by 1 (1,2,3...)
Key Concept
A number chart is like a map for numbers - it helps us navigate the number system and discover patterns.
Counting with Number Charts
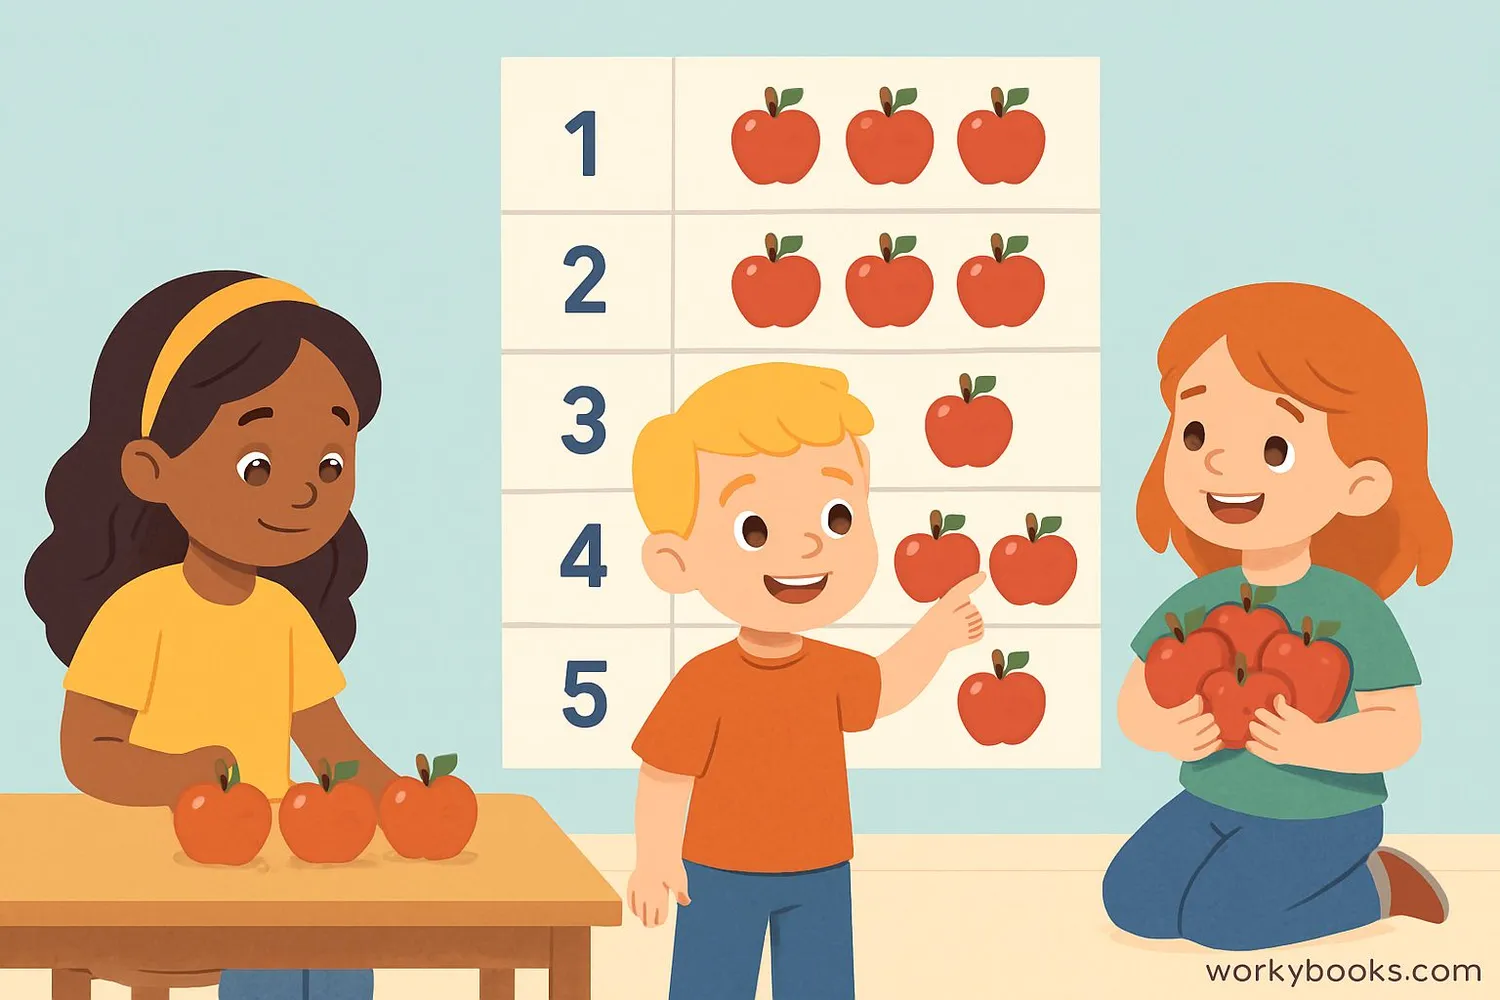
Number charts are perfect for learning to count. For young learners, charts from 1-10 or 1-20 help build number recognition and sequencing skills.
Counting Activities:
- Counting objects within 10: Count items and find the matching number on the chart
- Counting objects within 20: Extend counting to larger quantities
- Number identification: Point to numbers as you count aloud
- Missing numbers: Identify which numbers are missing from a sequence
Remember
When counting, the number chart helps us see that each number is one more than the number before it.
Skip Counting with Charts
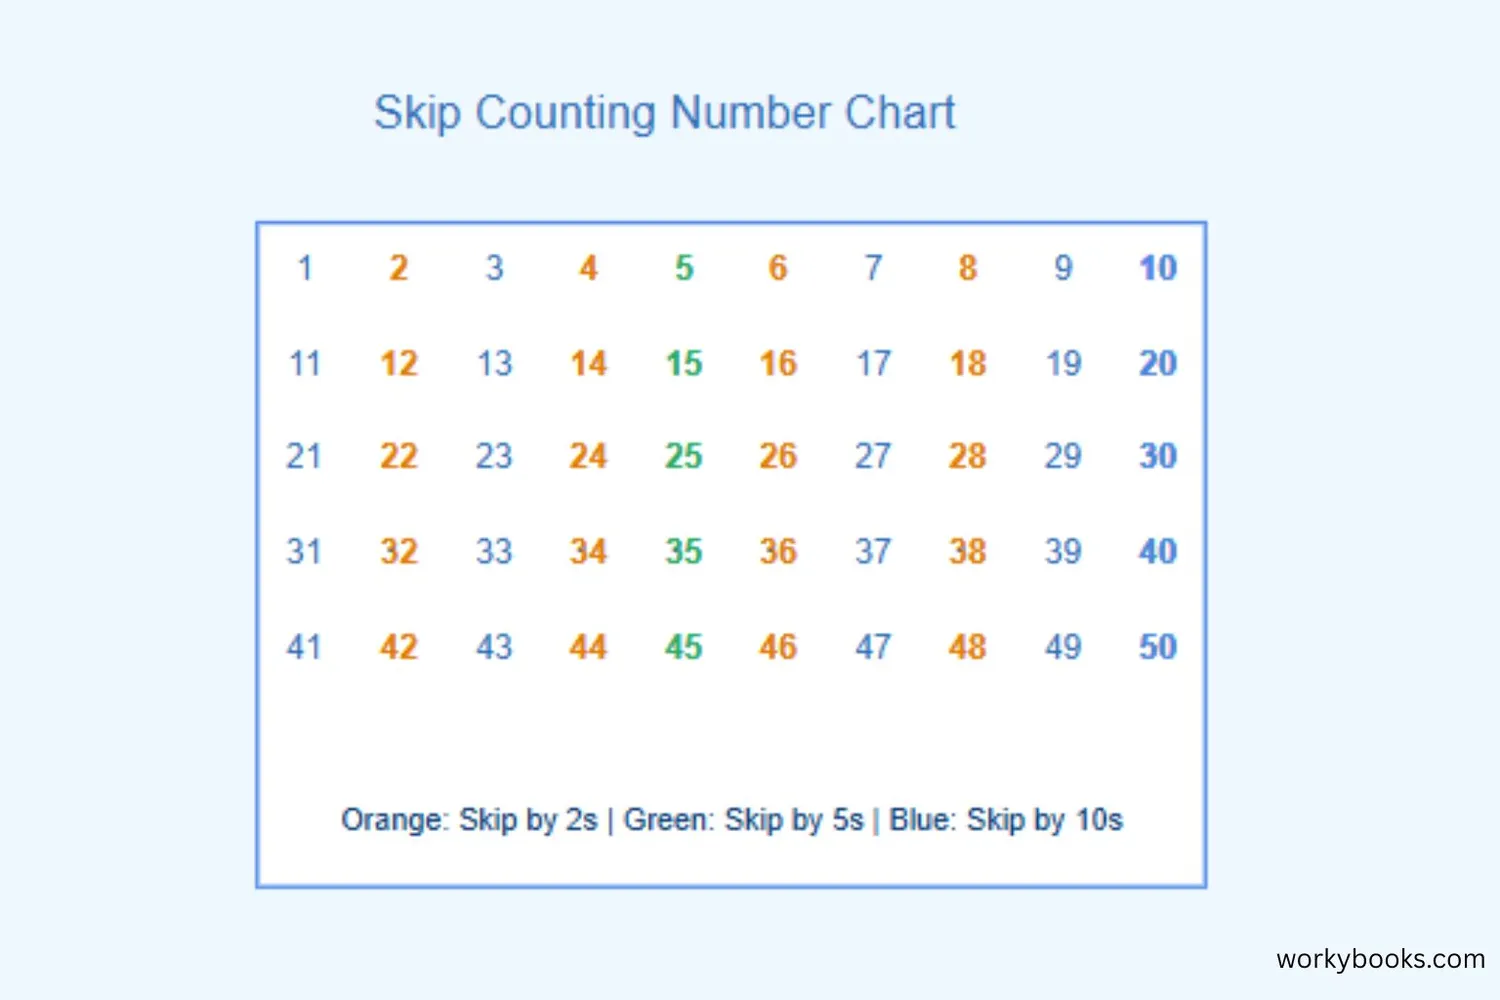
Skip counting means counting by numbers other than one. Number charts make skip counting patterns easy to see!
Common skip counting patterns:
- Skip count by 2: 2, 4, 6, 8, 10... (all even numbers)
- Skip count by 5: 5, 10, 15, 20, 25...
- Skip count by 10: 10, 20, 30, 40, 50...
- Skip count by 100: 100, 200, 300, 400...
Pattern Discovery
This helps us understand place value and counting patterns.
Math Operations with Charts
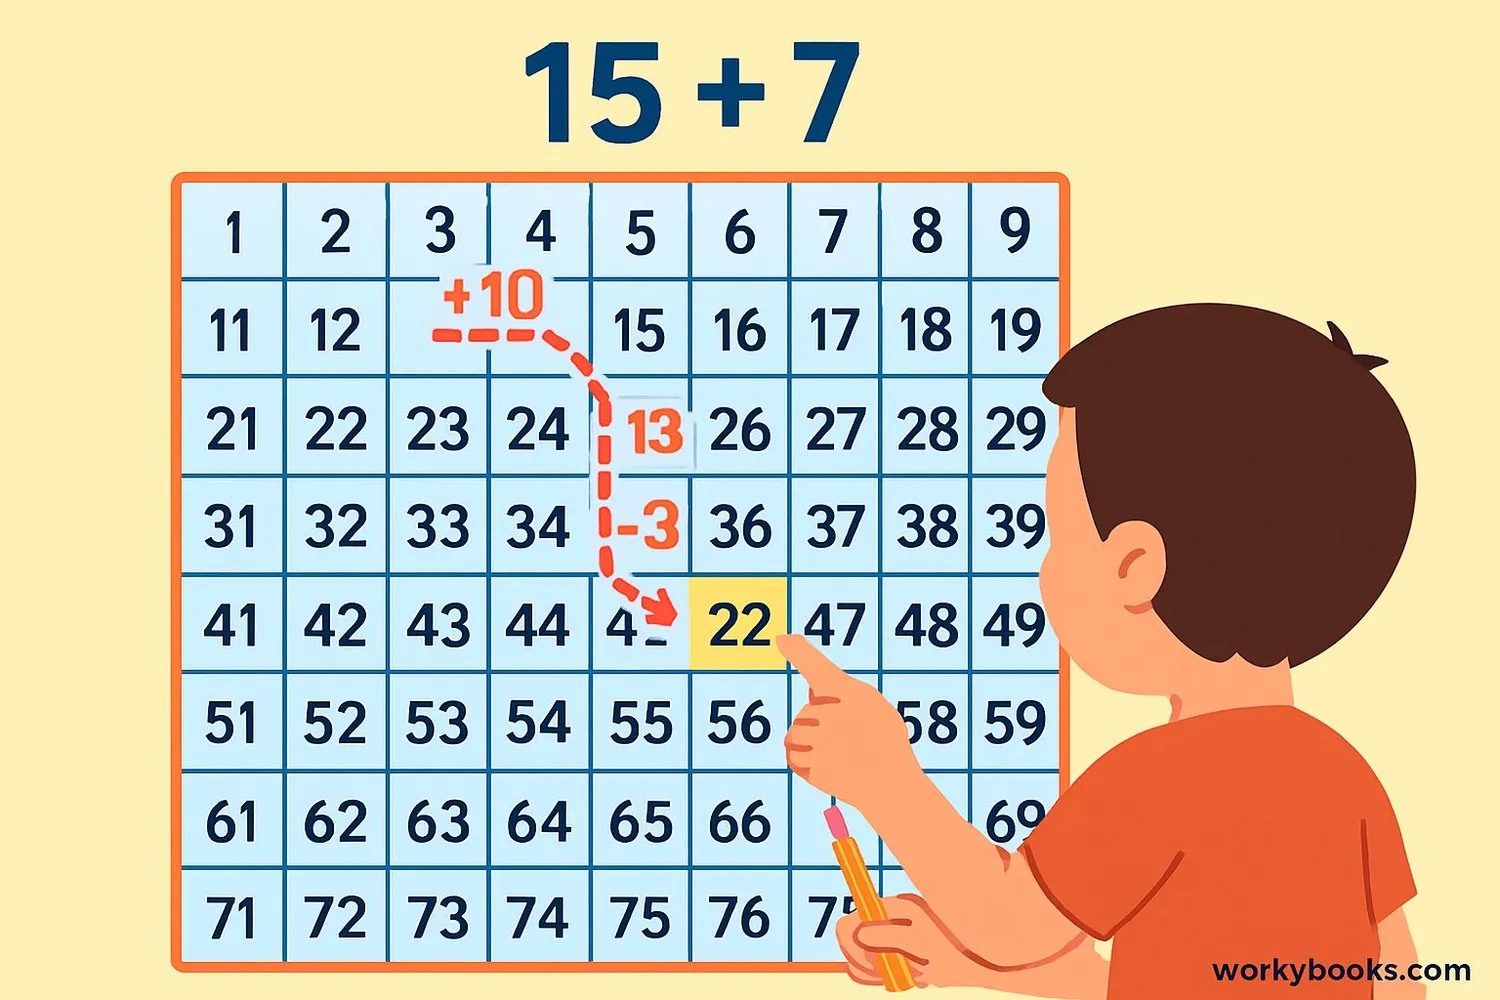
Number charts are excellent tools for learning addition, subtraction, and other operations. They help students visualize what happens when we add or subtract numbers.
Using charts for operations:
- Addition: Start at first number, move right for ones, down for tens
- Subtraction: Start at first number, move left for ones, up for tens
- Multiplication: Skip counting by the same number multiple times
- Division: Counting how many times a number fits into another
Subtraction Strategy
For 15 - 7: Start at 15, move left 5 spaces to 10, then up to 9,8 (that's 7 moves total). You land on 8!
- Comparing numbers (which is larger/smaller)
- Finding number bonds (pairs that make a number)
- Understanding place value
Number Patterns and Properties
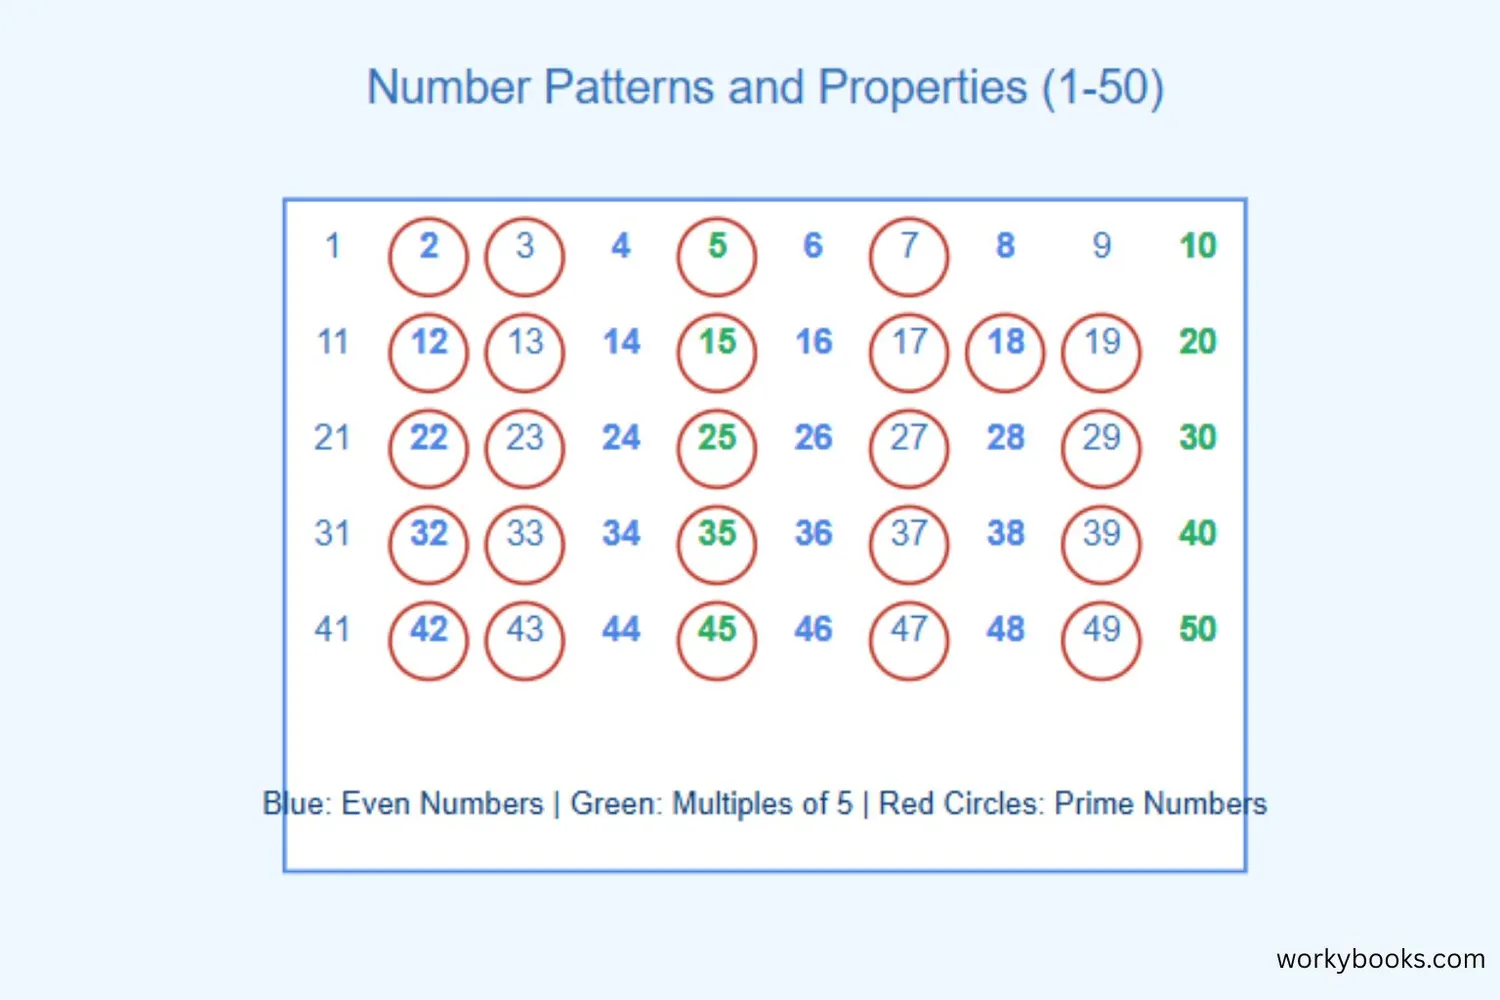
Number charts reveal fascinating patterns that help us understand number properties and relationships. When we highlight different types of numbers, interesting patterns emerge.
Patterns to explore:
- Even and odd numbers: Columns alternate between even and odd
- Prime and composite numbers: Primes have no factors except 1 and themselves
- Factors and multiples: Multiples form diagonal patterns
- Number sequences: Arithmetic sequences show as straight lines
Pattern Tip
Notice how prime numbers greater than 5 are always in the first or fifth column? That's because primes (except 2 and 5) end with 1, 3, 7, or 9!
Number Chart Quiz
Test your number chart knowledge with this 5-question quiz. Choose the correct answer for each question.
Frequently Asked Questions
Here are answers to common questions about number charts:
Math Trivia
Discover interesting facts about numbers and mathematics:
Ancient Number Charts
The oldest known number chart is the Ishango bone, dating back 20,000 years. This baboon fibula bone has notches arranged in patterns that suggest early humans were exploring prime numbers and multiplication.
The Power of 100
The 100-chart is so effective because our number system is base-10. This means we count in groups of ten, which matches the ten fingers on our hands. This natural grouping makes the 10x10 grid intuitive for learners.
Magic of Patterns
When you highlight multiples of any number on a number chart, they always form diagonal patterns. The angle of these diagonals depends on the number you're multiplying by, creating a visual multiplication table.
Largest Number Chart
The world's largest number chart was created in 2018 in India, measuring 100 feet by 100 feet. Over 5,000 students participated in filling in the numbers on this gigantic learning tool!
