
Venn Diagrams - Definition, Examples, Quiz, FAQ, Trivia
Learn about sets, intersections, and unions with visual tools and activities
What is a Venn Diagram?
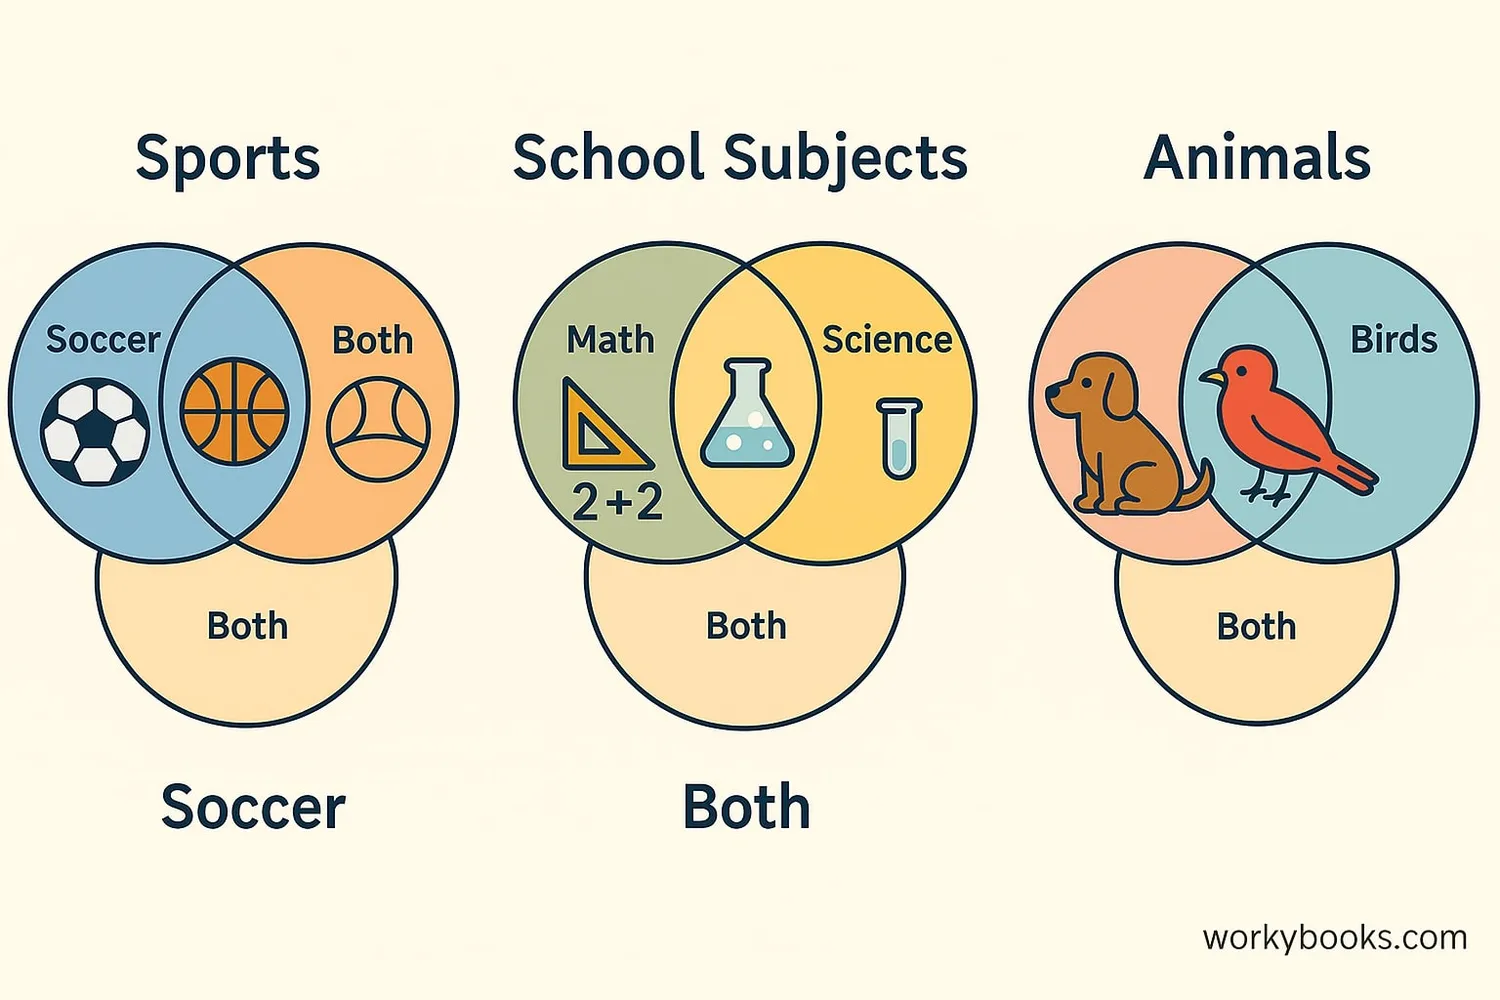
A Venn diagram is a visual tool that uses overlapping circles to show how different groups of things relate to each other.
Venn diagrams help us organize information and see what different groups have in common and what makes them different. They're named after John Venn, a mathematician who invented them in 1880.
Why are they useful? Venn diagrams help us:
- Compare and contrast different groups
- Find what items belong to multiple groups
- Solve logic problems
- Organize information visually
Key Concept
Each circle represents a group or category. Where circles overlap shows what those groups have in common.
Parts of a Venn Diagram
Let's learn the special names for each part of a Venn diagram:
Universal Set: This is everything we're talking about. It's like the big box that holds all the circles. We sometimes draw a rectangle around everything to show the universal set.
Circles: Each circle represents a group or category. For example, one circle might be "Pets" and another might be "Animals that live in water."
Intersection: Where circles overlap is called the intersection. This shows things that belong to both groups. For example, a turtle might be in both "Pets" and "Animals that live in water."
Union: The union is everything in either circle or both circles. It's like combining both groups together.
Complement: The area outside a circle but inside the universal set is the complement. It shows things that are not in that group.
Remember
The overlapping area is the most important part - it shows what different groups have in common!
Set Operations
We use special symbols to talk about different parts of Venn diagrams:
Union (A ∪ B): This means everything in set A OR set B OR both. The symbol ∪ looks like a cup that holds everything.
Intersection (A ∩ B): This means only things that are in BOTH set A AND set B. The symbol ∩ looks like an upside down cup that catches only what's shared.
Complement (A'): This means everything that is NOT in set A. The symbol ' is like a little flag that says "not this one."
Let's see how this works with animals:
- Set A: Animals with fur
- Set B: Animals that can fly
- A ∩ B: Animals with fur that can fly (like bats)
- A ∪ B: All animals that either have fur OR can fly OR both
- A': Animals without fur (like fish or reptiles)
Math Tip
The intersection symbol (∩) looks like the letter "n" for "both" - helping you remember it's where sets come together.
How to Draw a Venn Diagram
Drawing your own Venn diagram is easy! Just follow these steps:
Step 1: Decide what to compare
Choose two or three groups you want to compare. For example: "Fruits" and "Red Foods."
Step 2: Draw circles
Draw overlapping circles on paper. Make sure they overlap enough to write in the middle.
Step 3: Label your sets
Write the name of each group above its circle.
Step 4: Place your items
Think about where each item belongs:
- Apples go in the overlap (they're fruits AND red)
- Bananas go only in "Fruits"
- Tomatoes go in the overlap (they're fruits and often red)
- Strawberries go in the overlap
- Carrots go only in "Red Foods" (if you count them as red)
Step 5: Check your diagram
Make sure each item is in the right place. Nothing should be in two places at once!
Drawing Tip
Start with just two circles. When you're comfortable, try adding a third circle that overlaps both!
Venn Diagram Examples
Venn diagrams are used everywhere! Here are some examples:
Example 1: Favorite Foods
Circle A: Pizza Lovers
Circle B: Ice Cream Fans
Overlap: People who like both pizza and ice cream
Example 2: Classroom Pets
Circle A: Furry Animals
Circle B: Animals that live in water
Overlap: Animals that are furry and live in water? (Maybe none!)
Example 3: Transportation
Circle A: Things with wheels
Circle B: Things that fly
Overlap: Things with wheels that fly? (Airplanes!)
Example 4: Numbers
Circle A: Even numbers
Circle B: Numbers greater than 5
Overlap: Numbers that are even AND greater than 5 (6, 8, 10...)
Real-World Use
Doctors use Venn diagrams to find diseases with similar symptoms. Business people use them to compare products!
Venn Diagram Quiz
Test your knowledge with this 5-question quiz. Choose the correct answer for each question.
Frequently Asked Questions
Here are answers to common questions about Venn diagrams:
Math Trivia
Discover interesting facts about sets and diagrams:
Ancient Origins
Similar diagrams were used as early as the 1200s by philosopher Ramon Llull. Leonhard Euler popularized them in the 1700s before John Venn formalized them in 1880.
Beyond Circles
While circles are most common, Venn diagrams can use other shapes too! For four sets, some mathematicians use ellipses instead of circles to show all possible overlaps clearly.
Computer Science
Venn diagrams are used in computer programming for database searches. The "AND" and "OR" operations in search engines work just like intersections and unions in Venn diagrams.
Famous Diagram
The most famous Venn diagram might be the "What I Think I Do" meme that shows overlapping circles with different perspectives of a job or activity, popular on social media.
