
Data - Definition, Examples, Quiz, FAQ, Trivia
Learn about information collection and analysis with easy explanations and practice activities
What is Data?
Data is information we collect about things. It can be numbers, words, pictures, or even sounds!
We use data to learn about the world around us. For example, when you count how many apples are in a basket, that number is data. When you write down your friends' favorite colors, those words are data too!
Data helps us answer questions and make decisions. Scientists use data to understand nature, doctors use data to help people stay healthy, and teachers use data to help students learn better.
Key Concept
Data is all around us! It's the information we collect to understand things better.
Collecting Data
Collecting data means gathering information. There are many ways to collect data:
1. Observing: Watching and recording what you see (like counting birds at a feeder)
2. Measuring: Using tools to find sizes or amounts (like measuring your height)
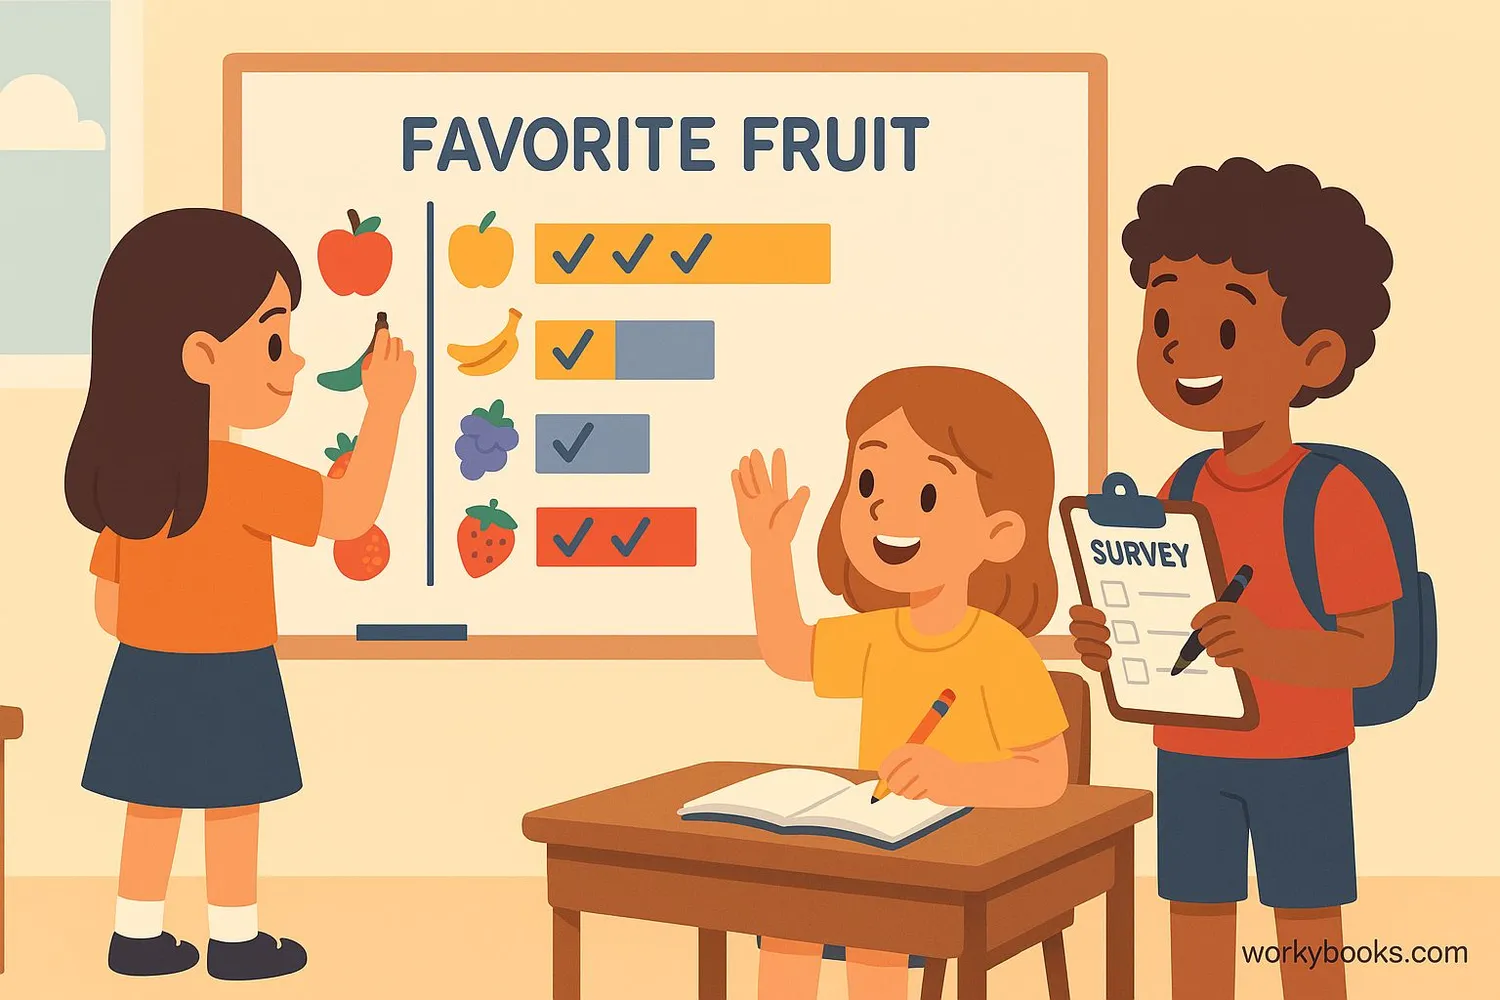
3. Surveying: Asking people questions (like "What's your favorite color?")
4. Experiments: Testing things to see what happens (like growing plants with different amounts of water)
When collecting data, it's important to be accurate. Write down your information clearly and double-check your work!
Data Collection Tip
Always record your data as soon as you collect it so you don't forget!
Organizing Data
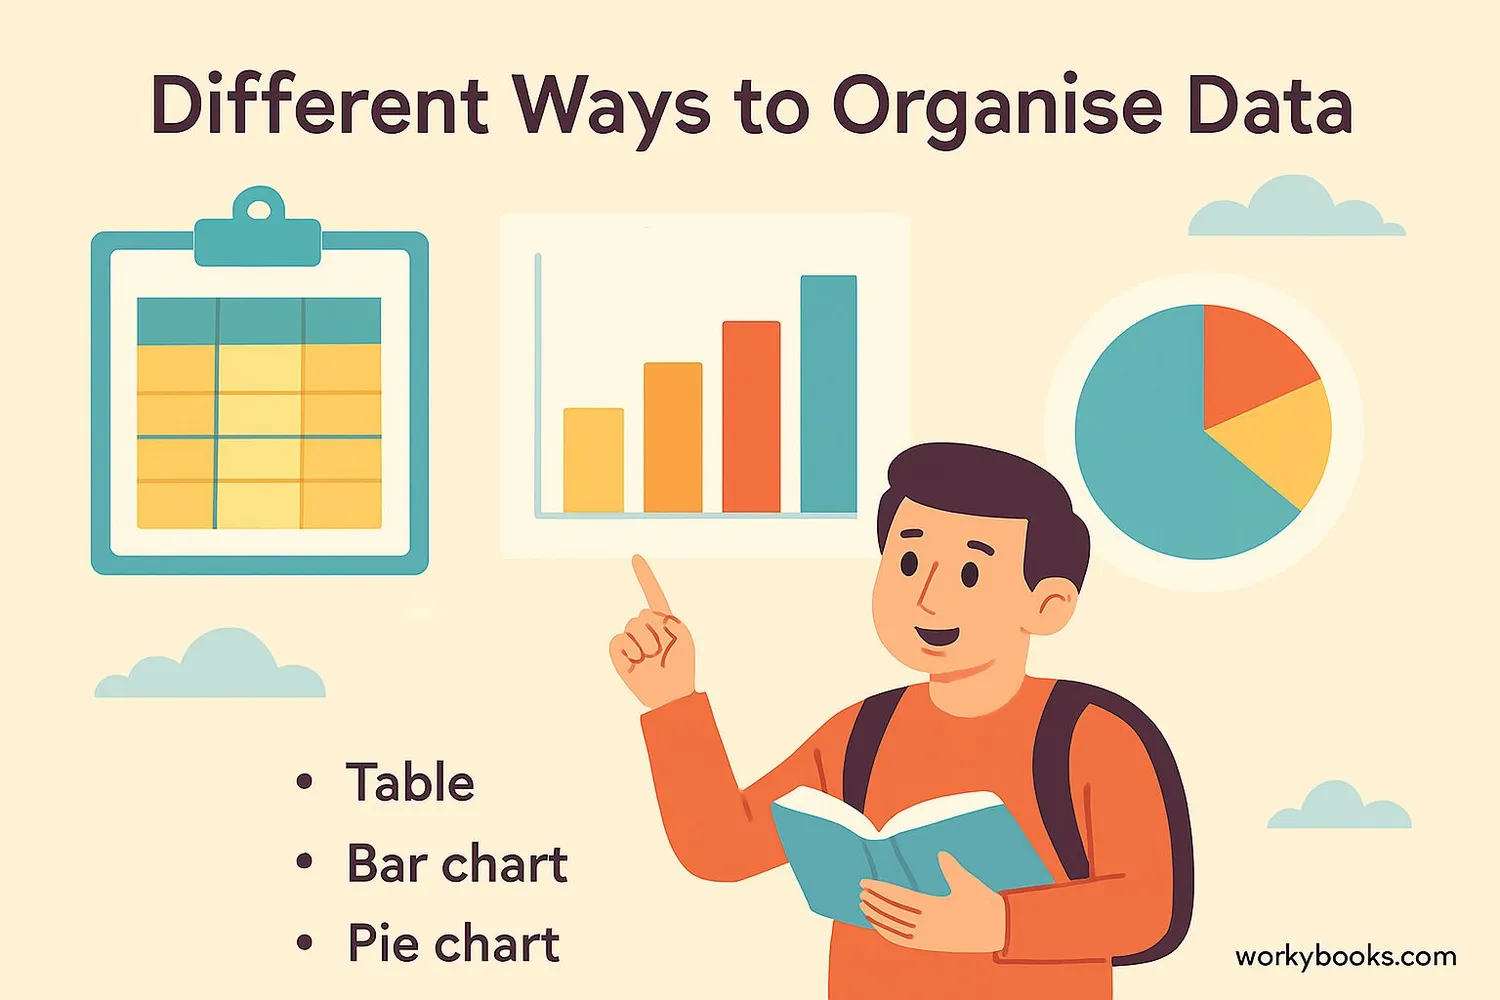
Once we collect data, we need to organize it so we can understand it better. Here are some ways to organize data:
Tables: Put information in rows and columns
Lists: Write information in a simple list
Charts: Show information with pictures (like bar charts or pie charts)
Let's look at an example. If we survey classmates about their favorite fruits:
| Name | Favorite Fruit |
|---|---|
| Alex | Apple |
| Bella | Banana |
| Carlos | Strawberry |
| Dana | Apple |
| Eli | Orange |
Now we can count how many people like each fruit and organize that information:
| Fruit | Number of Students |
|---|---|
| Apple | 2 |
| Banana | 1 |
| Strawberry | 1 |
| Orange | 1 |
Organization Tip
Organizing data helps us see patterns and understand information more easily!
Analyzing Data
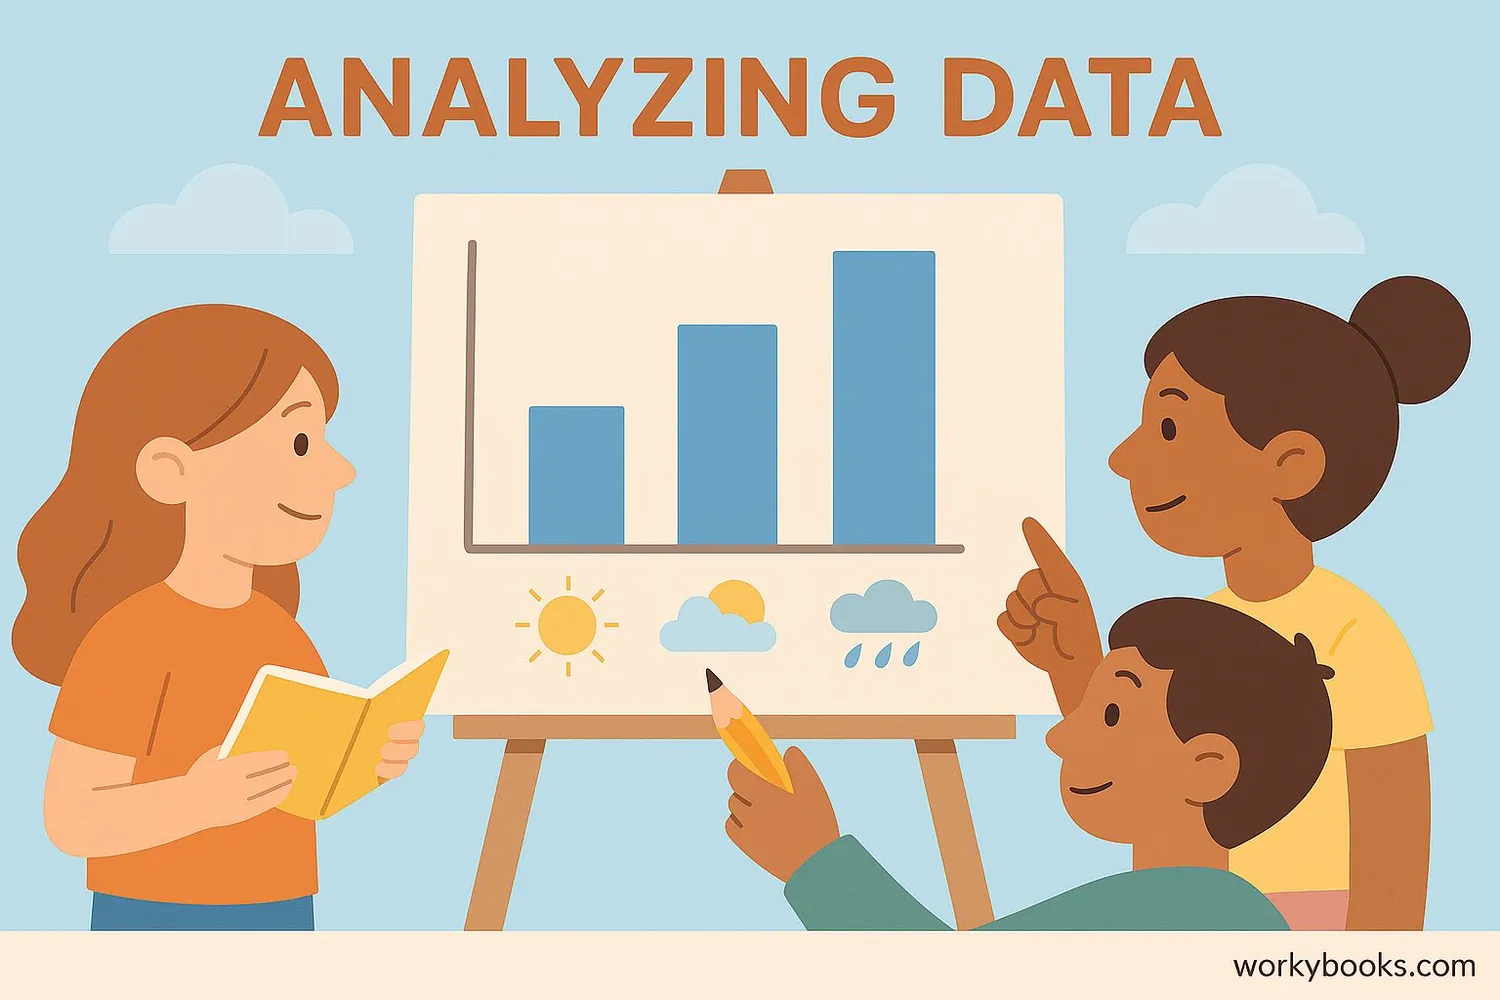
Analyzing data means looking at the information we've collected and organized to find patterns or answers to our questions.
When we analyze data, we can:
1. Compare: See which things are bigger, smaller, or the same
2. Find patterns: Notice if something happens more at certain times or places
3. Answer questions: Use the data to find solutions to problems
Let's analyze our fruit survey data:
• Which fruit is the most popular? Apple (2 students)
• How many students chose fruits? 5
• How many fruits have only one vote? 3 (Banana, Strawberry, Orange)
We can use this information to decide which fruits to bring for a class party!
Analysis Tip
Look for the story in your data - what is it telling you?
Data Knowledge Quiz
Test what you've learned with this 5-question quiz. Choose the correct answer for each question.
Frequently Asked Questions
Here are answers to common questions about data:
Data Trivia
Discover interesting facts about data:
Ancient Data
People have been collecting data for thousands of years! Ancient Egyptians collected data about the Nile River floods, and Babylonians recorded data about stars and planets.
Data in Nature
Animals collect data too! Bees remember where flowers are located, squirrels remember where they buried nuts, and birds use data about the sun's position to navigate.
Space Data
The Hubble Space Telescope collects so much data that it would take about 1,400 CD-ROMs to store just one week's worth of its observations!
Data Explosion
More data has been created in the last two years than in all of human history before that! We now create about 2.5 quintillion bytes of data every day.
