This learning resource is available in interactive and printable formats. The interactive worksheet can be played online and assigned to students. The Printable PDF version can be downloaded and printed for completion by hand.
Word search on Data and Statistics Word Search! Vocabulary practice aligned to Common Core standards!
Perfect For:
👩🏫 Teachers
• Interactive classroom activities
• Auto-graded game assignments
• Student engagement tools
👨👩👧👦 Parents
• Fun learning at home
• Educational screen time
• Progress tracking
🏠 Homeschoolers
• Interactive curriculum
• Self-paced gaming
• Engaging practice
Game Features:
🎮
Interactive Gameplay
Engaging educational game experience
📊
Auto-Grading
Instant feedback and scoring
📝
Assignable
Perfect for homework and classwork
📄
Printable Components
Additional offline materials
Common Core Standards Covered
1.MD.C.4
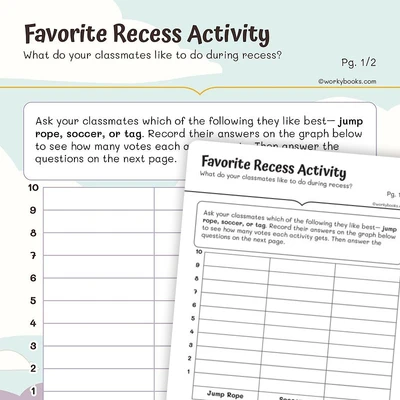
Organize, represent, and interpret data with up to three categories; ask and answer questions about the total number of data points, how many in each category, and how many more or less are in one category than in another.
2.MD.D.10
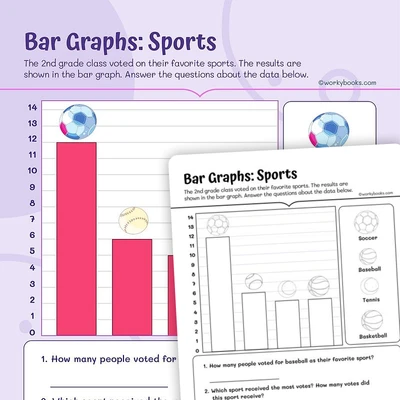
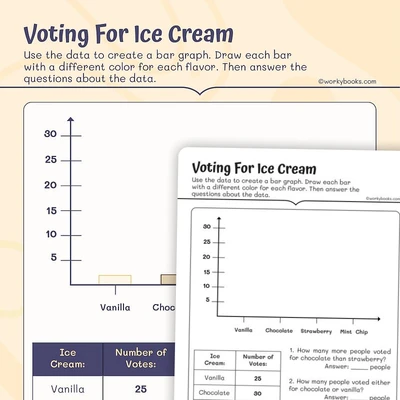
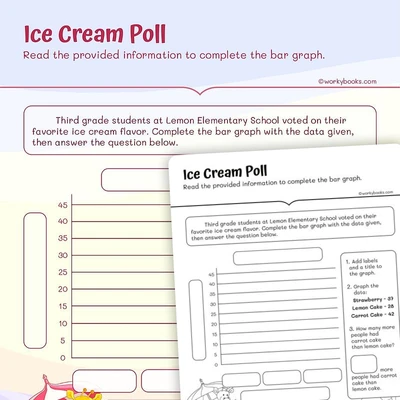
Draw a picture graph and a bar graph (with single-unit scale) to represent a data set with up to four categories. Solve simple put-together, take-apart, and compare problems1 using information presented in a bar graph.
3.MD.B.3
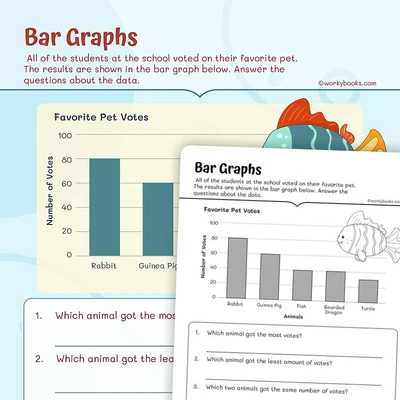
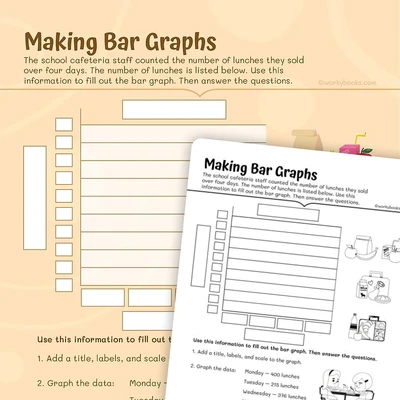
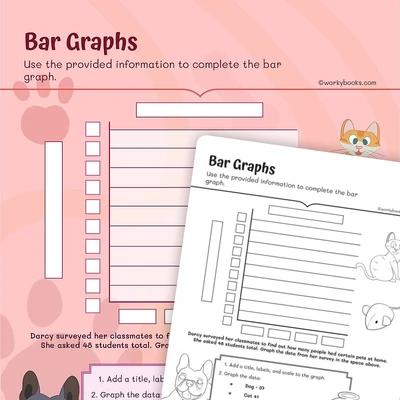
Draw a scaled picture graph and a scaled bar graph to represent a data set with several categories. Solve one- and two-step "how many more" and "how many less" problems using information presented in scaled bar graphs. For example, draw a bar graph in which each square in the bar graph might represent 5 pets.
4.MD.B.4
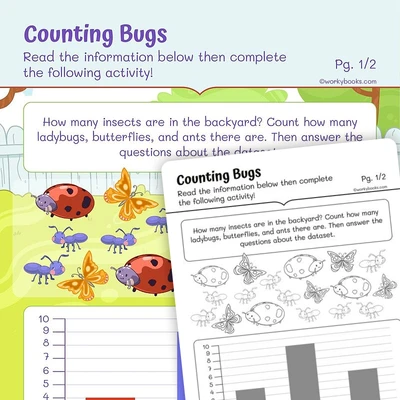
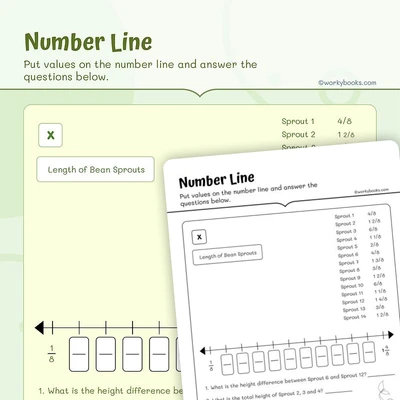
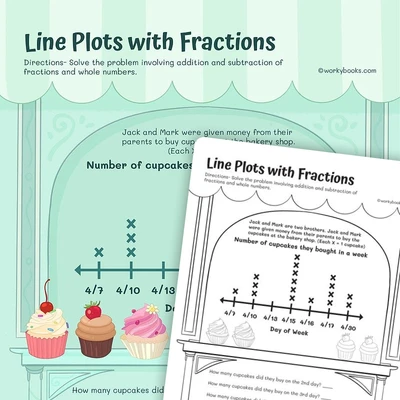
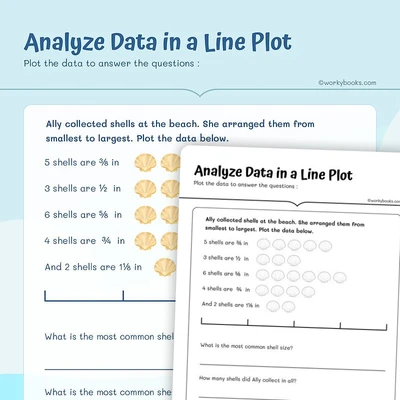
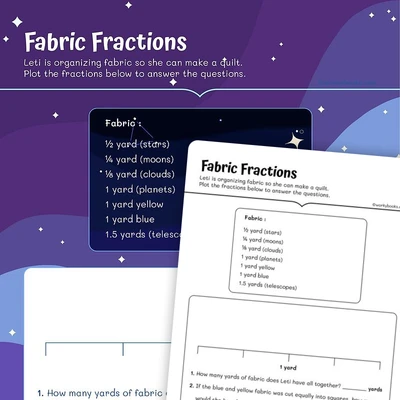
Make a line plot to display a data set of measurements in fractions of a unit (1/2, 1/4, 1/8). Solve problems involving addition and subtraction of fractions by using information presented in line plots. For example, from a line plot find and interpret the difference in length between the longest and shortest specimens in an insect collection.
5.MD.B.2
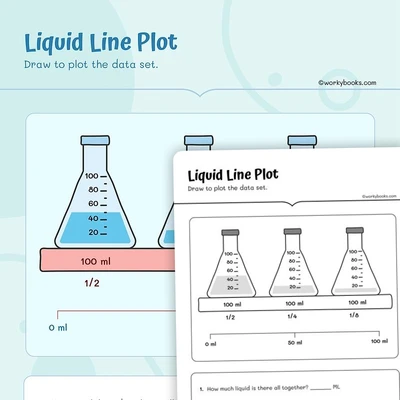
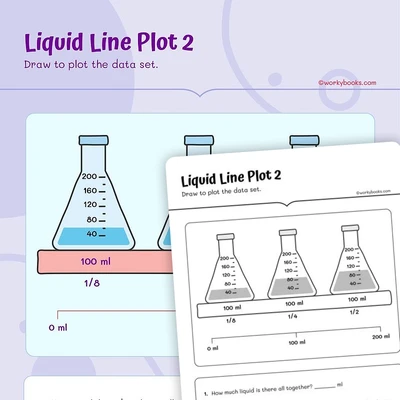
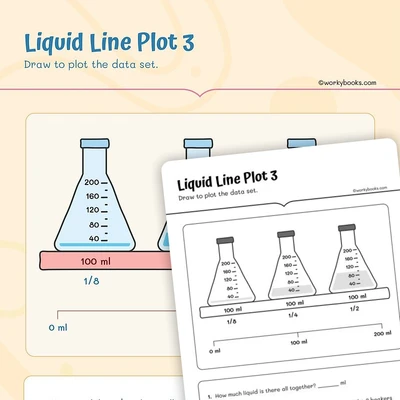
Make a line plot to display a data set of measurements in fractions of a unit (1/2, 1/4, 1/8). Use operations on fractions for this grade to solve problems involving information presented in line plots. For example, given different measurements of liquid in identical beakers, find the amount of liquid each beaker would contain if the total amount in all the beakers were redistributed equally.
K.MD.B.3
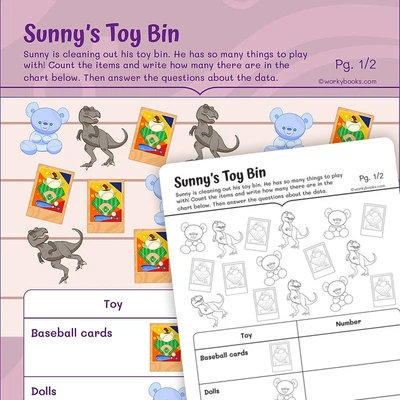
Classify objects into given categories; count the numbers of objects in each category and sort the categories by count.1
Reviews & Ratings
No reviews yet. Be the first to share your experience!
Related Resources
Counting Bugs
The bar graph on this sheet shows how many ants, butterflies, and ladybugs there are in the backyard. The insects themse...
1.MD.C.4
Represent and interpret Data
This worksheet on bar graphs is a fun way for your students to get familiar with this concept. Students will create the ...
1.MD.C.4
Organizing and Interpreting Data
This worksheet is a great way to introduce working with data up to three cateogries. Students will look at the toys illu...
1.MD.C.4
Voting for Ice Cream—Reading Data
In this activity, students will create a bar graph and interpret the data. Students must use the given data to correctly...
2.MD.D.10
Bar Graphs: Sports
This worksheet is a great introduction to bar graphs. Students will read information from 4 categories on the graph, the...
2.MD.D.10
Plotting Data Points
This worksheet on bar graphs will have students interpret data up to 50. Students will add a title, label, and scale to ...
3.MD.B.3
Scaled Pictographs
This worksheet on bar graphs will have students interpret data on ice cream poll up to 50. Students will add a title, la...
3.MD.B.3
Bar Graphs
This worksheet on bar graphs has 5 different categories and uses data up to 100. Your students will love interpreting da...
3.MD.B.3
Making Bar Graphs
This worksheet on bar graphs will have students interpret data up to 450. Students will graph the data, and then answer ...
3.MD.B.3
Number Line
Students will make a Line Plot to display a data set of measurements in fractions of a unit and solve problems involving...
4.MD.B.4
Line Plots with Fractions
Students will solve problems involving addition and subtraction of fractions by using information presented in Line Plot...
4.MD.B.4
Analyze Data in a Line Plot
Analyze data in a line plot with this 4th grade math worksheet, aligned with Common Core Standard 4.MD.B.4. Students wil...