
Frequency Table - Definition, Examples, Quiz, FAQ, Trivia
Learn to organize and understand data with frequency tables, tally marks, and charts
What is a Frequency Table?
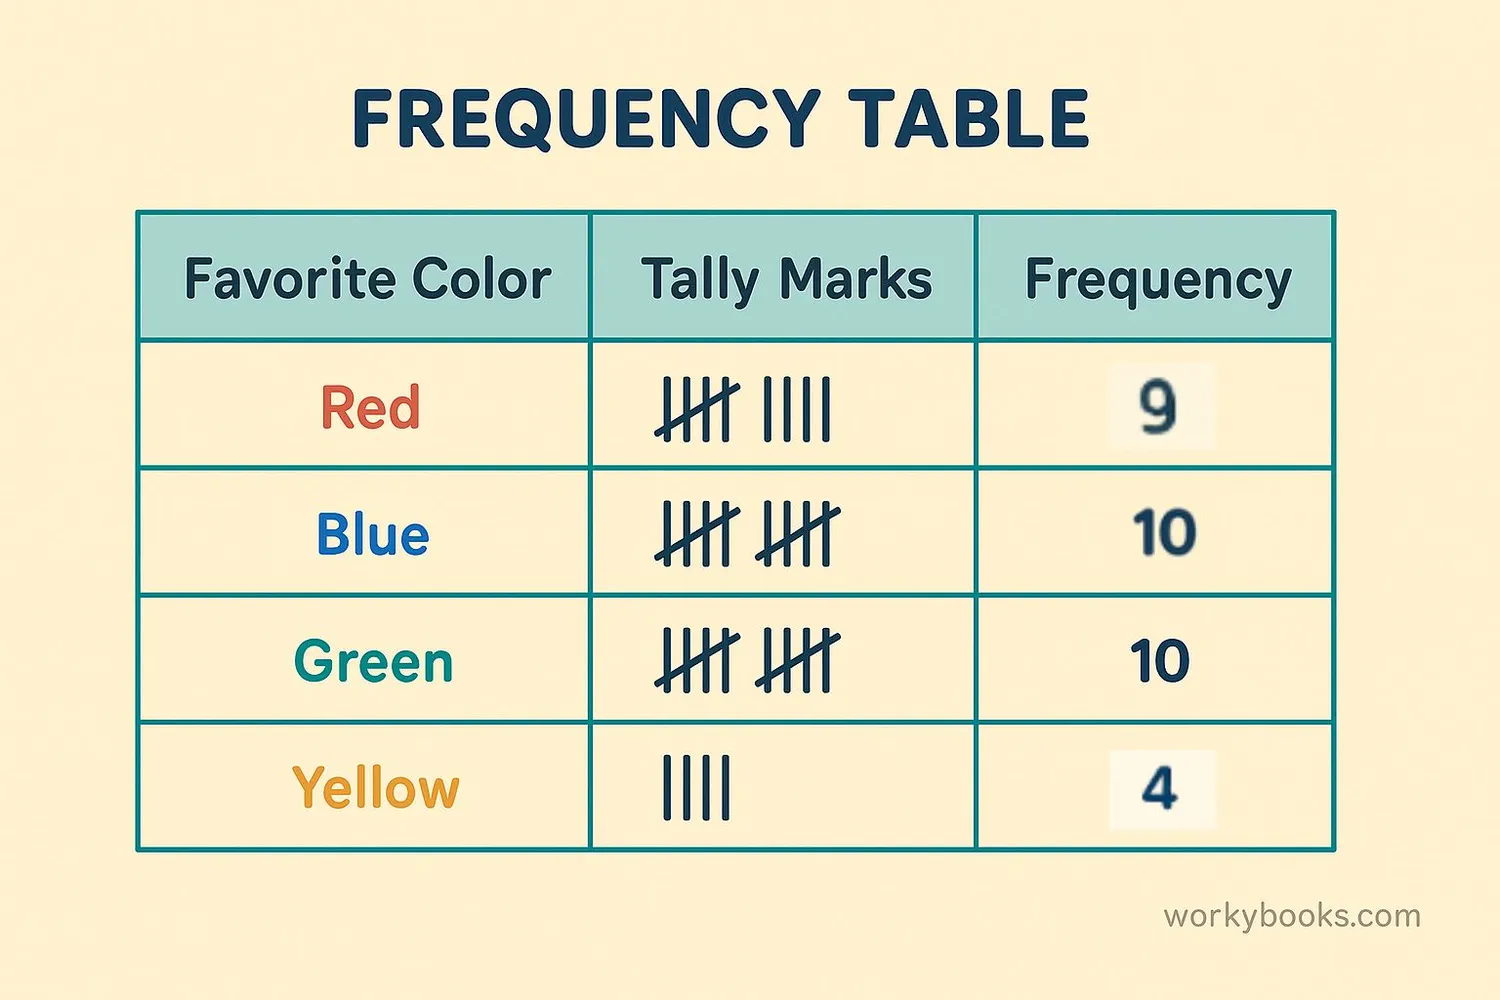
A frequency table is a way to organize data to show how often each value or category appears. It helps us understand patterns in data by counting how many times something occurs.
Frequency tables have three main parts:
1. Categories or values - These are the different items or groups we're counting
2. Tally marks - These are marks (like little lines) that help us count items quickly
3. Frequency - This is the total count for each category
Frequency tables help us see which values are most common and which are least common. They're like a organized list that makes data easier to understand!
Key Concept
Frequency means "how often." A frequency table shows how often different values appear in a set of data.
Types of Frequency Tables
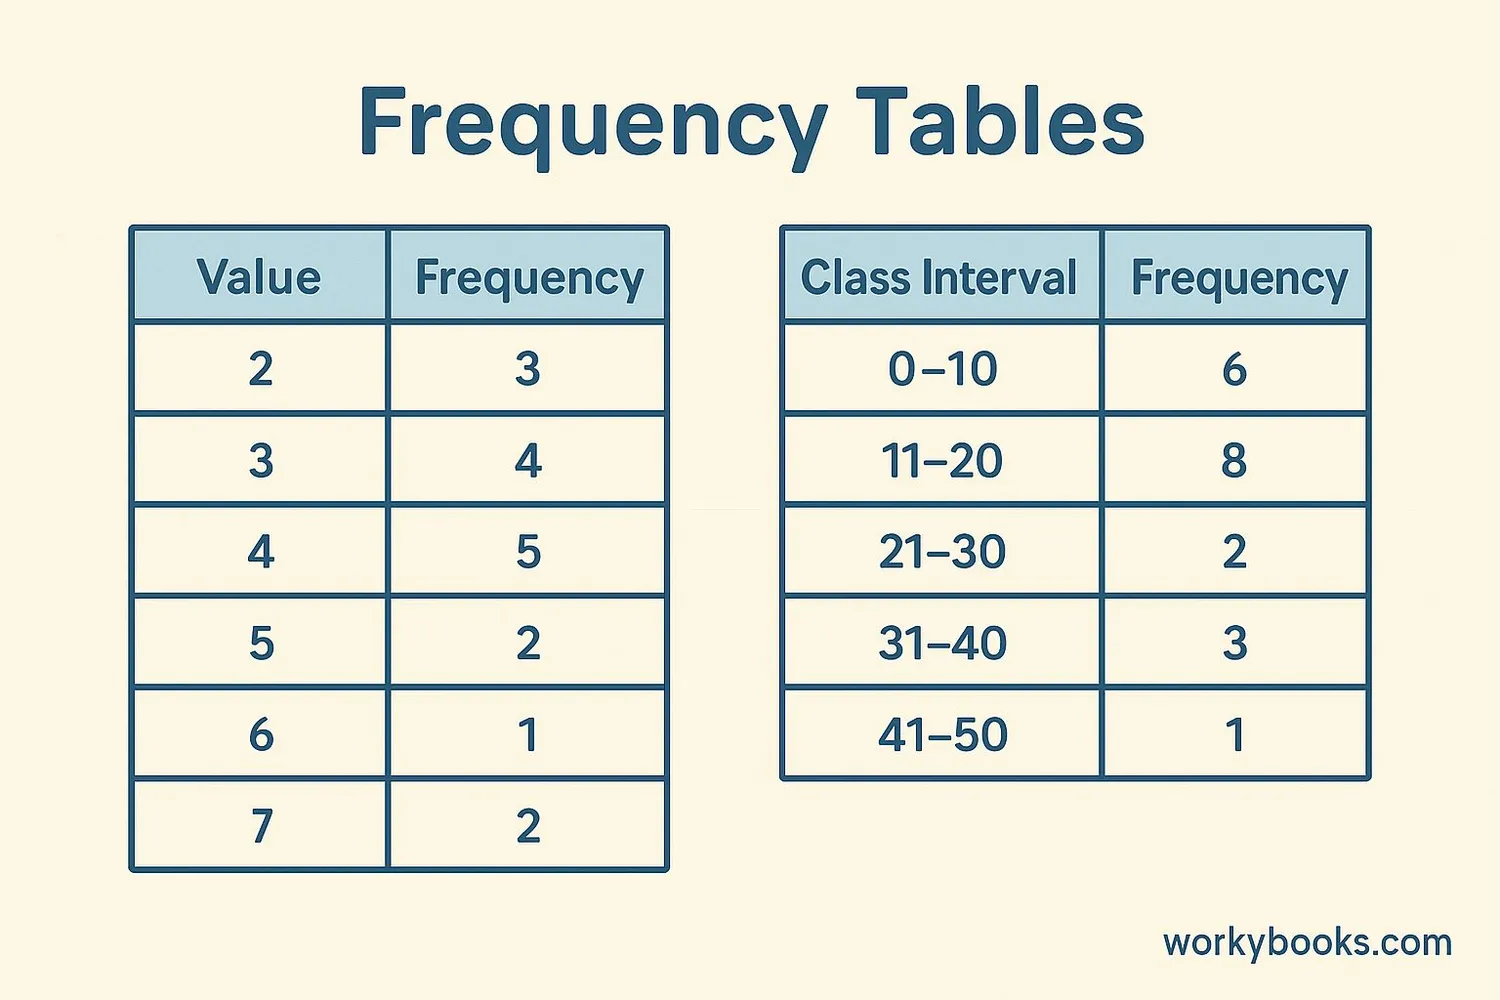
There are different types of frequency tables for different kinds of data:
1. Ungrouped Frequency Distribution Table: This table shows each individual value and how often it appears. It's best when we have a small number of different values.
2. Grouped Frequency Distribution Table: This table groups values into intervals or ranges called "class intervals." It's useful when we have many different values. Each group has:
- Lower limit: The smallest number in the interval
- Upper limit: The largest number in the interval
3. Cumulative Frequency Distribution Table: This special table shows the running total of frequencies as we go through the categories.
The type of table we use depends on our data and what we want to learn from it!
Remember
Grouped frequency tables use class intervals to organize data into ranges like 0-10, 11-20, etc. This helps when we have many different values.
How to Make a Frequency Table
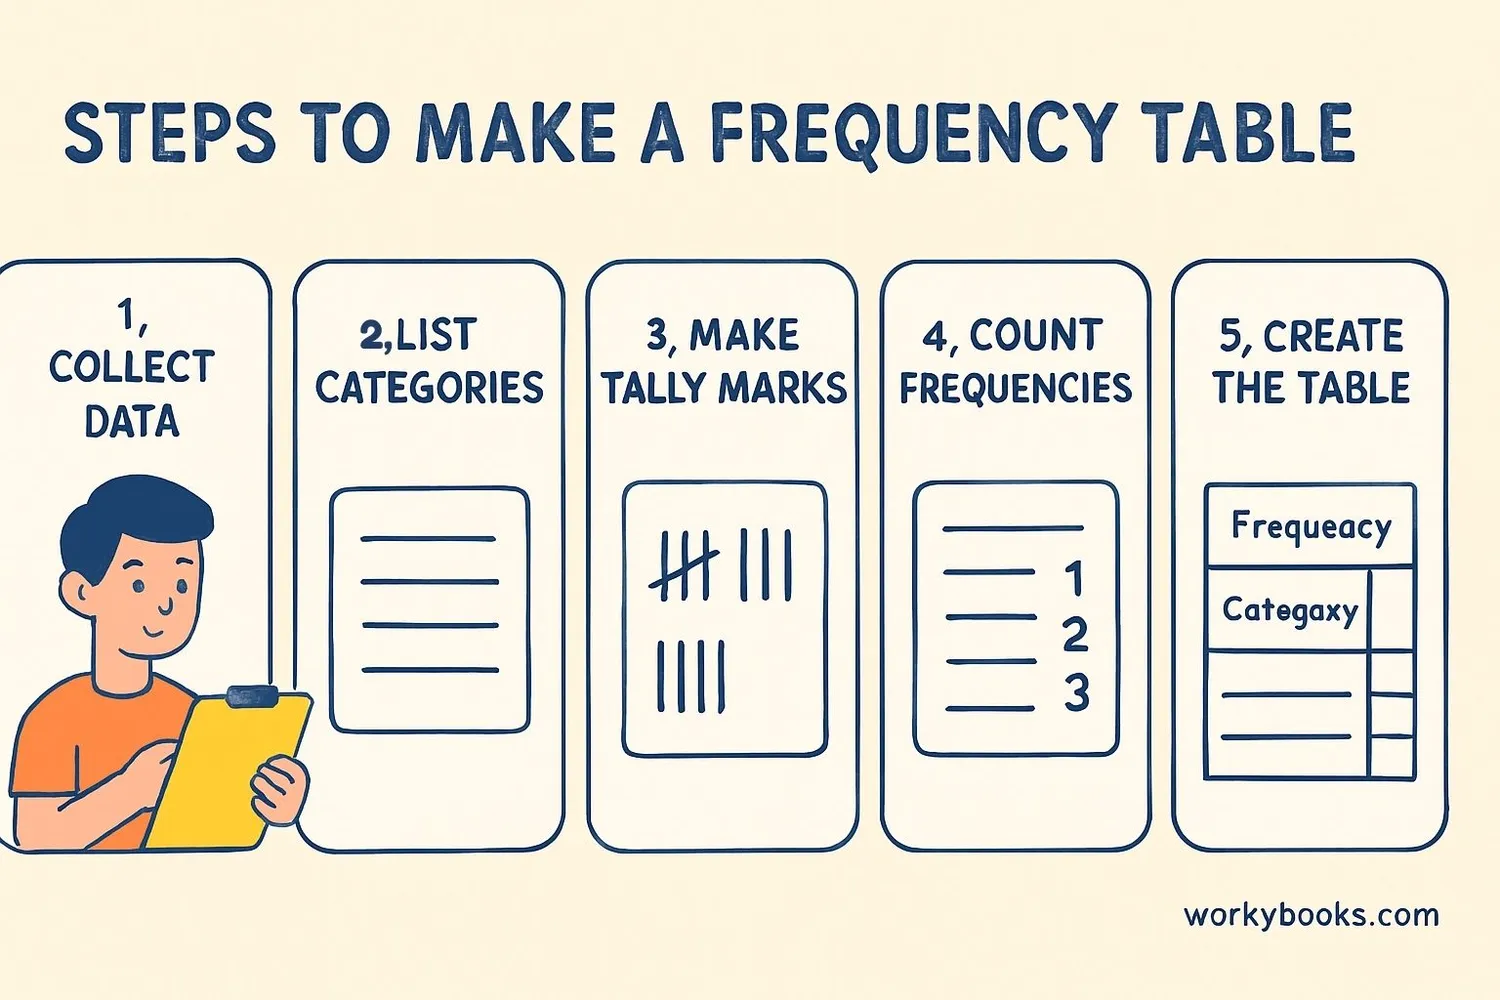
Creating a frequency table is easy when you follow these steps:
Step 1: Collect your data - Gather all the information you want to organize.
Step 2: List the categories - Write down all the different values or groups in your data.
Step 3: Make tally marks - Go through your data and make a tally mark (丨) for each item next to its category. After every fourth tally, make a diagonal mark (/) to group them in fives.
Step 4: Count the frequencies - Count the tally marks for each category and write the total number.
Step 5: Create your table - Make a neat table with columns for the categories, tally marks, and frequencies.
Let's practice with an example: If we surveyed 15 students about their favorite fruit and got: apple, banana, apple, orange, banana, apple, apple, orange, banana, apple, orange, banana, apple, banana, apple.
| Favorite Fruit | Tally Marks | Frequency |
|---|---|---|
| Apple | 卌 卌 | 7 |
| Banana | 卌 丨 | 5 |
| Orange | Ⅲ | 3 |
Real-World Examples
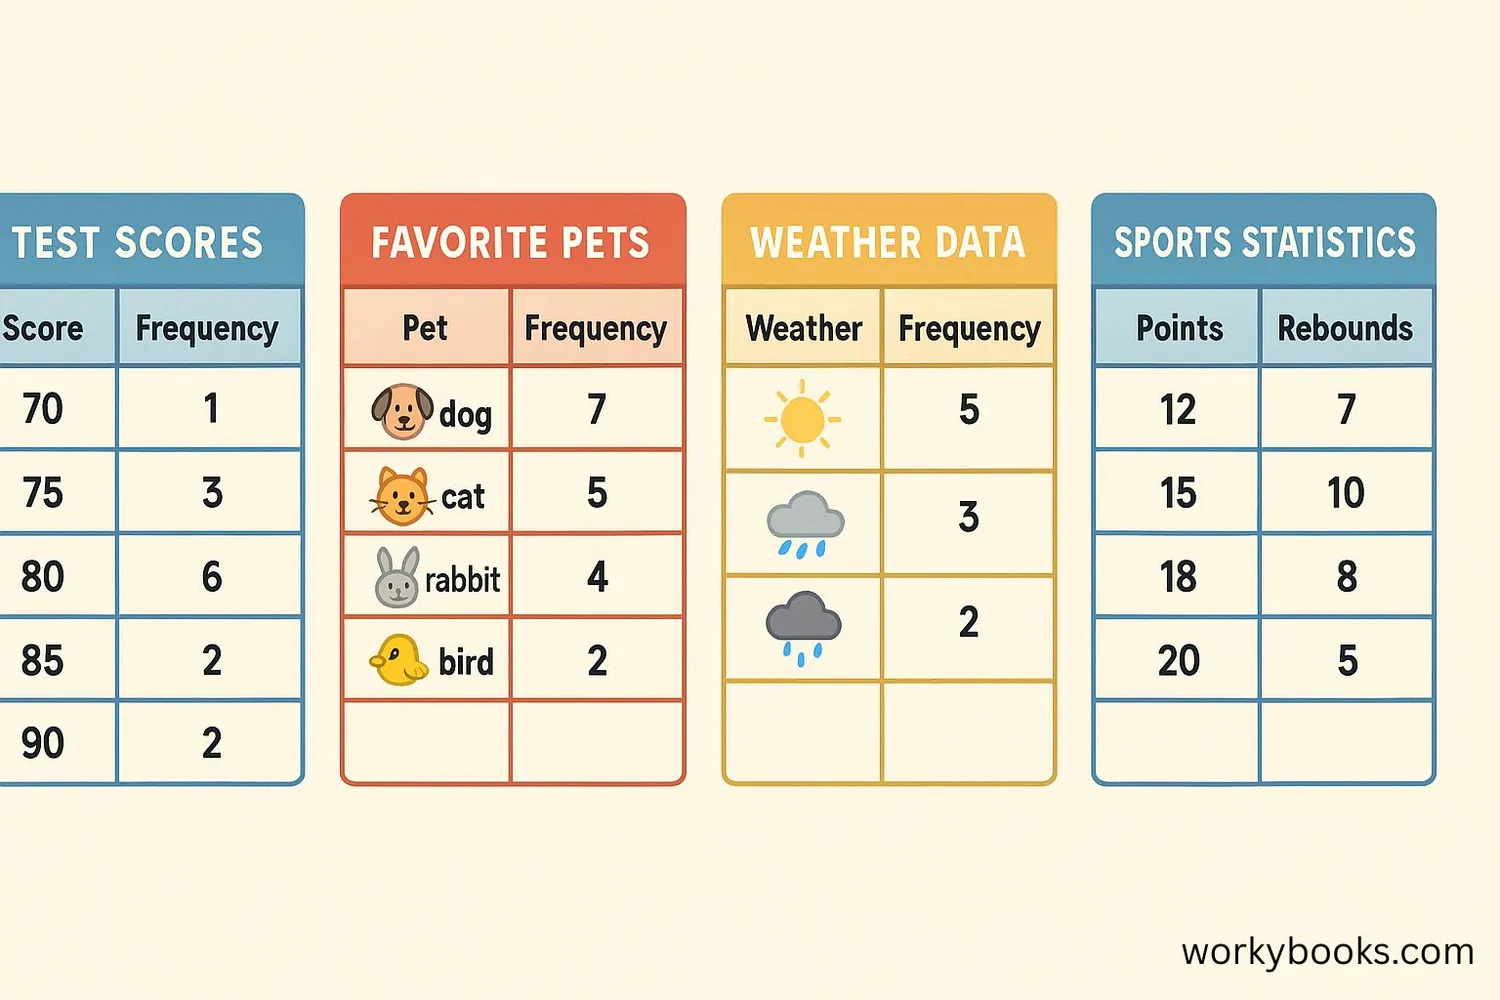
Frequency tables are used in many real-life situations. Here are some examples:
Example 1: Test Scores - Teachers use frequency tables to see how students performed on a test.
| Score Range | Number of Students |
|---|---|
| 90-100 | 5 |
| 80-89 | 8 |
| 70-79 | 10 |
| 60-69 | 4 |
| Below 60 | 2 |
Example 2: Favorite Pets - A survey of favorite pets in a class.
| Pet | Tally | Frequency |
|---|---|---|
| Dog | 卌 卌 Ⅲ | 13 |
| Cat | 卌 卌 | 9 |
| Fish | 卌 丨 | 6 |
| Bird | Ⅲ | 3 |
| Other | 丨 | 1 |
Example 3: Weather Data - Meteorologists use frequency tables to track how many sunny, cloudy, or rainy days occur each month.
Frequency tables help us see patterns and make sense of numbers and categories in our world!
Frequency Table Practice Quiz
Test your understanding of frequency tables with this 5-question quiz. Choose the correct answer for each question.
Frequently Asked Questions
Here are answers to common questions about frequency tables:
Data Trivia
Discover interesting facts about data organization and frequency tables:
Ancient Data Collection
The earliest known use of data collection and organization dates back to ancient Egypt around 3000 BCE. Egyptians used early forms of tally marks to keep records of crops, livestock, and population.
Tally Mark Origins
The word "tally" comes from the Latin word "talea" meaning "twig" or "cutting." Ancient people would make notches on sticks to keep count, and the stick would be split lengthwise to create a record for both parties in a transaction.
World's Largest Data Collection
The Large Hadron Collider at CERN generates approximately 30 petabytes (30 million gigabytes) of data per year. Scientists use advanced frequency tables and data organization methods to make sense of this enormous amount of information.
Data in Daily Life
Frequency tables are used everywhere! Supermarkets use them to track popular products, TV networks use them to see which shows people watch, and teachers use them to understand student performance. You probably encounter frequency tables more often than you realize!
