
Linear Graphs - Definition, Examples, Quiz, FAQ, Trivia
Learn to create and understand straight line graphs with easy explanations and practice activities
What is a Linear Graph?
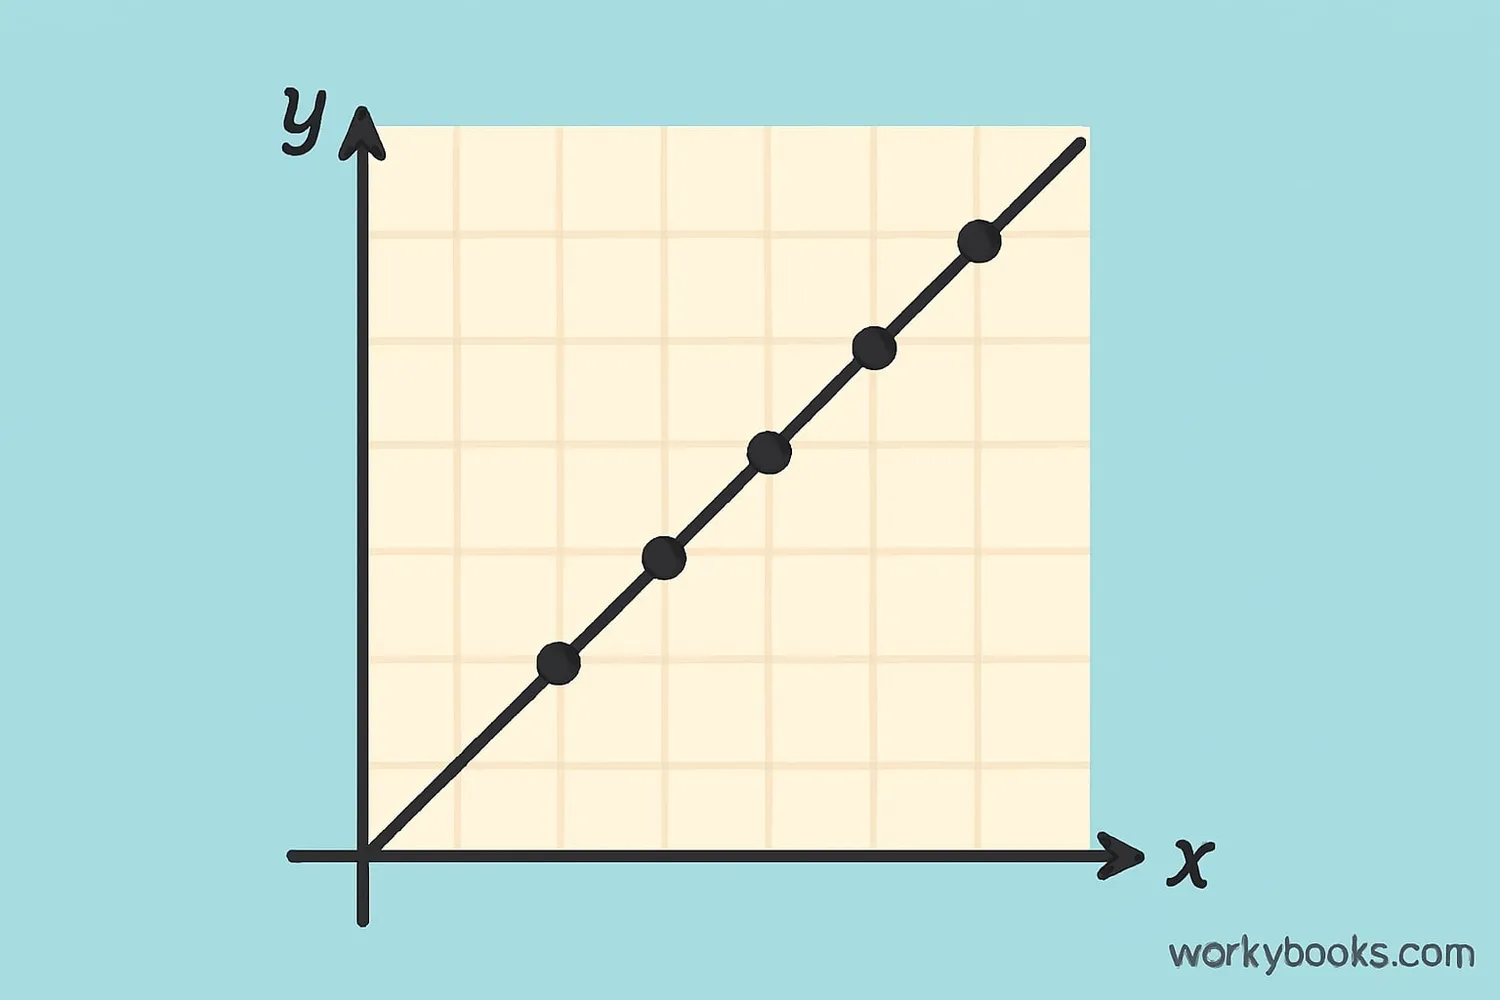
A linear graph is a special type of graph that shows a straight line. It represents a relationship between two things where one changes at a constant rate as the other changes.
Think of it like climbing stairs - each step takes you up the same height. In a linear graph, when one value increases, the other increases (or decreases) by the same amount each time.
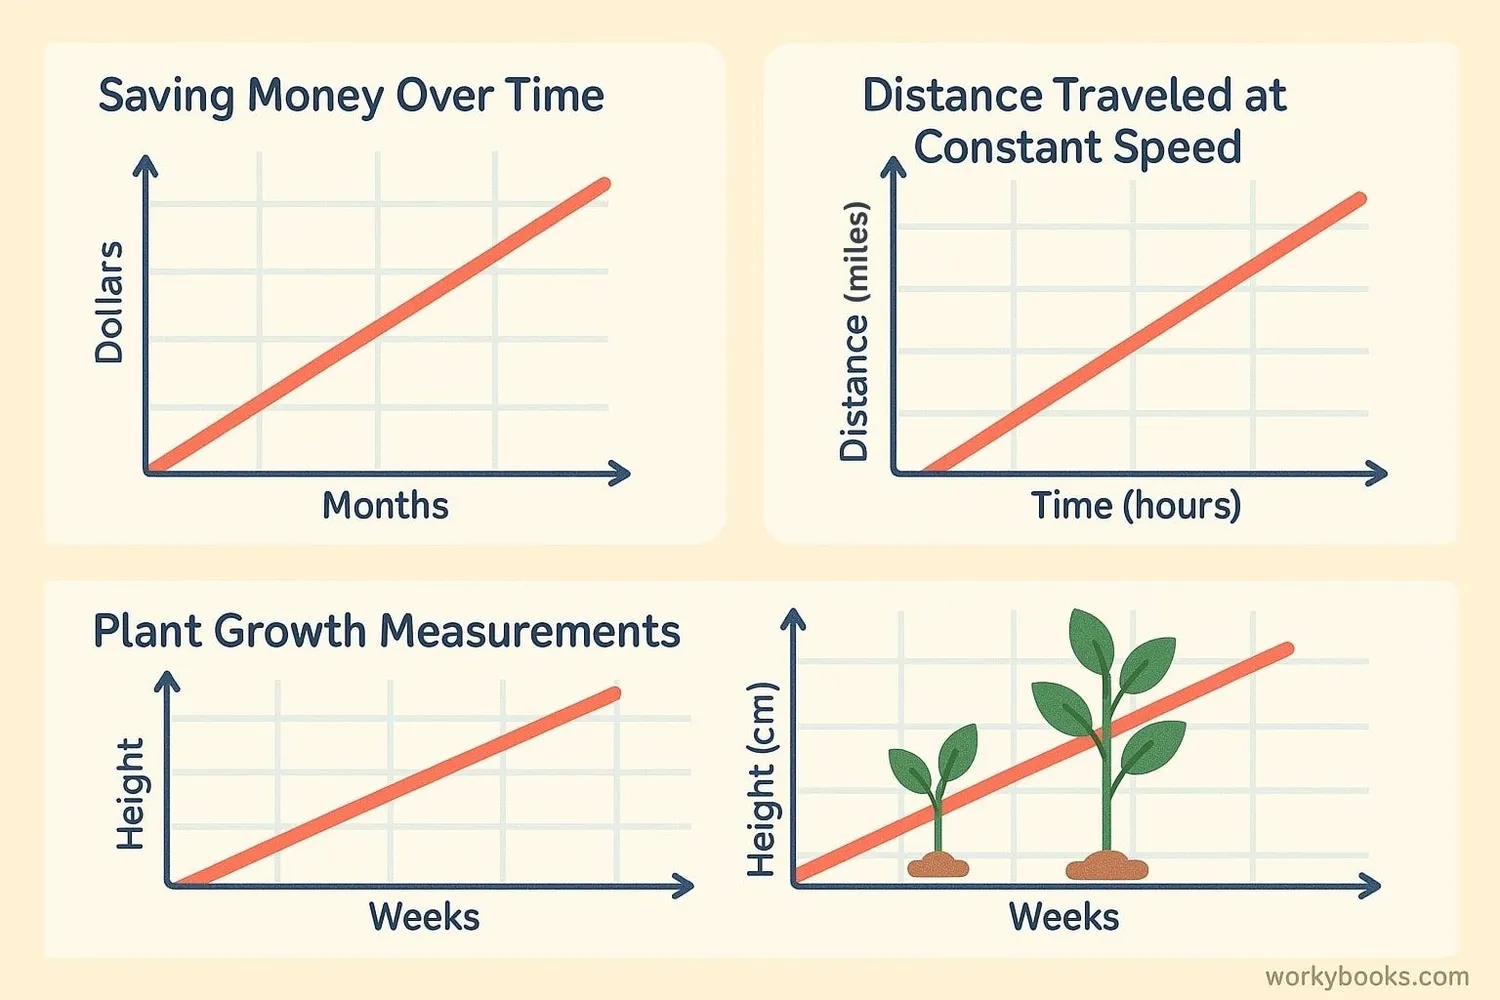
Linear graphs are used to show relationships between numbers. For example, they can show how the cost of apples changes as you buy more of them, or how a plant grows the same amount each week.
Key Concept
A linear graph always forms a straight line. If the points don't make a straight line, it's not a linear relationship.
How to Create Linear Graphs
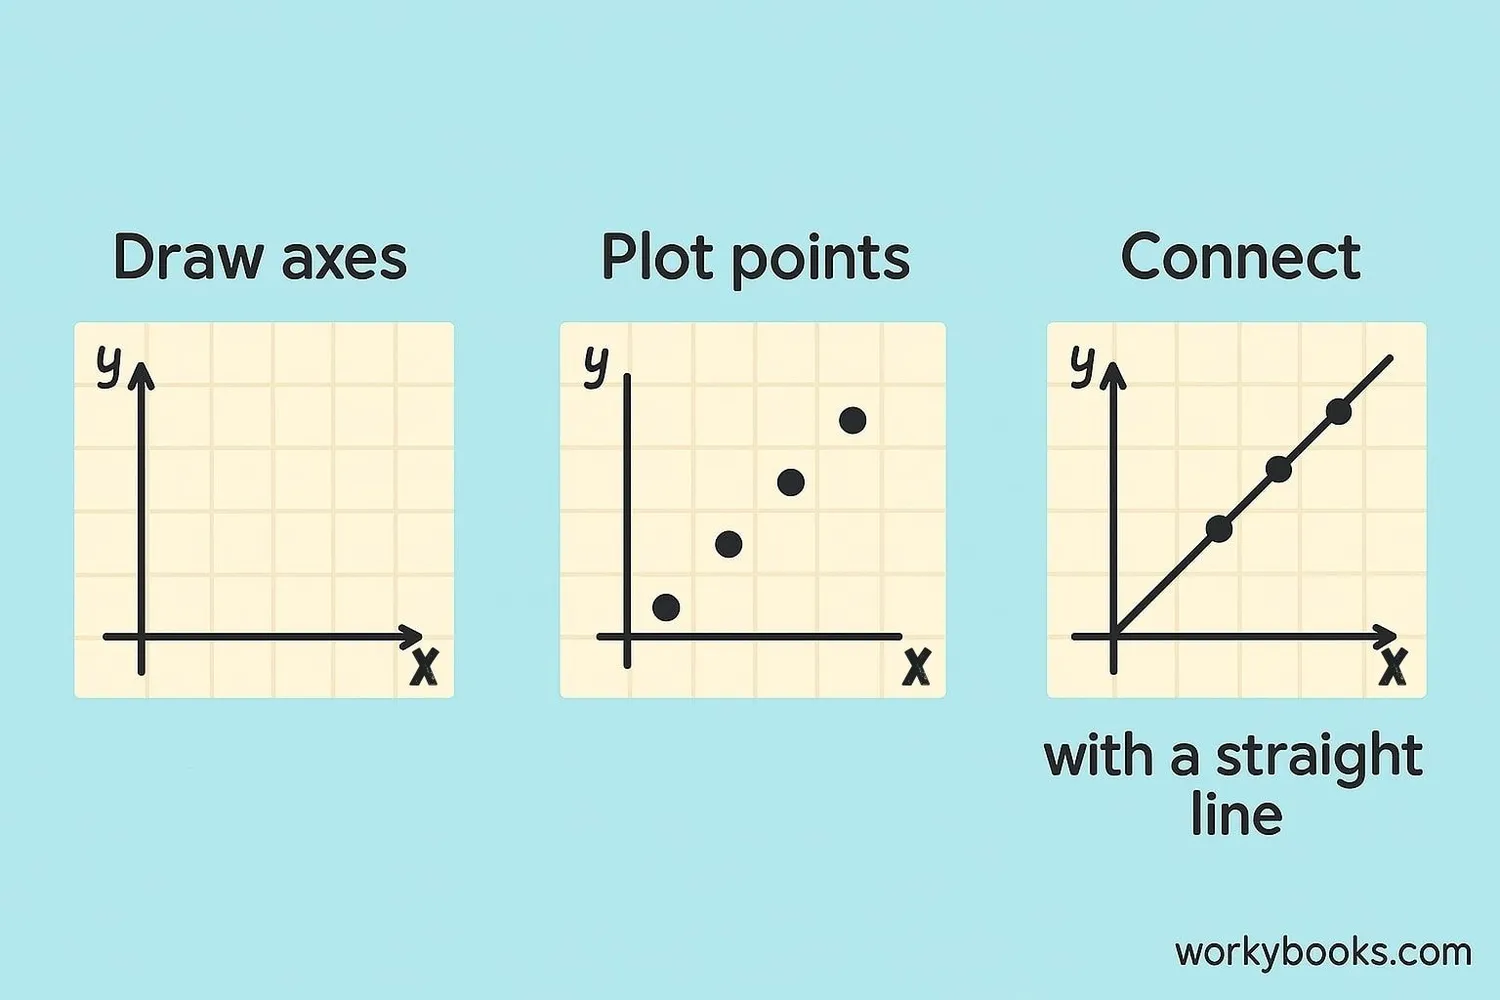
Creating a linear graph is like connecting dots to make a straight line. Here's how to do it:
Step 1: Draw your coordinate plane with x-axis (horizontal) and y-axis (vertical)
Step 2: Plot points using pairs of numbers (coordinates)
Step 3: Connect the points with a straight line
Step 4: Add labels to your axes and a title to your graph
Let's practice with an example. If you know that for every hour you study, your test score goes up by 5 points, you could make a linear graph to show this relationship.
Linear Equation Formula
This formula helps us create linear graphs. 'm' tells us how steep the line is, and 'b' tells us where the line crosses the y-axis.
Remember
All the points on a linear graph should line up perfectly. If they don't, double-check your work!
Reading Linear Graphs
Reading a linear graph helps us understand relationships between things. Here's what to look for:
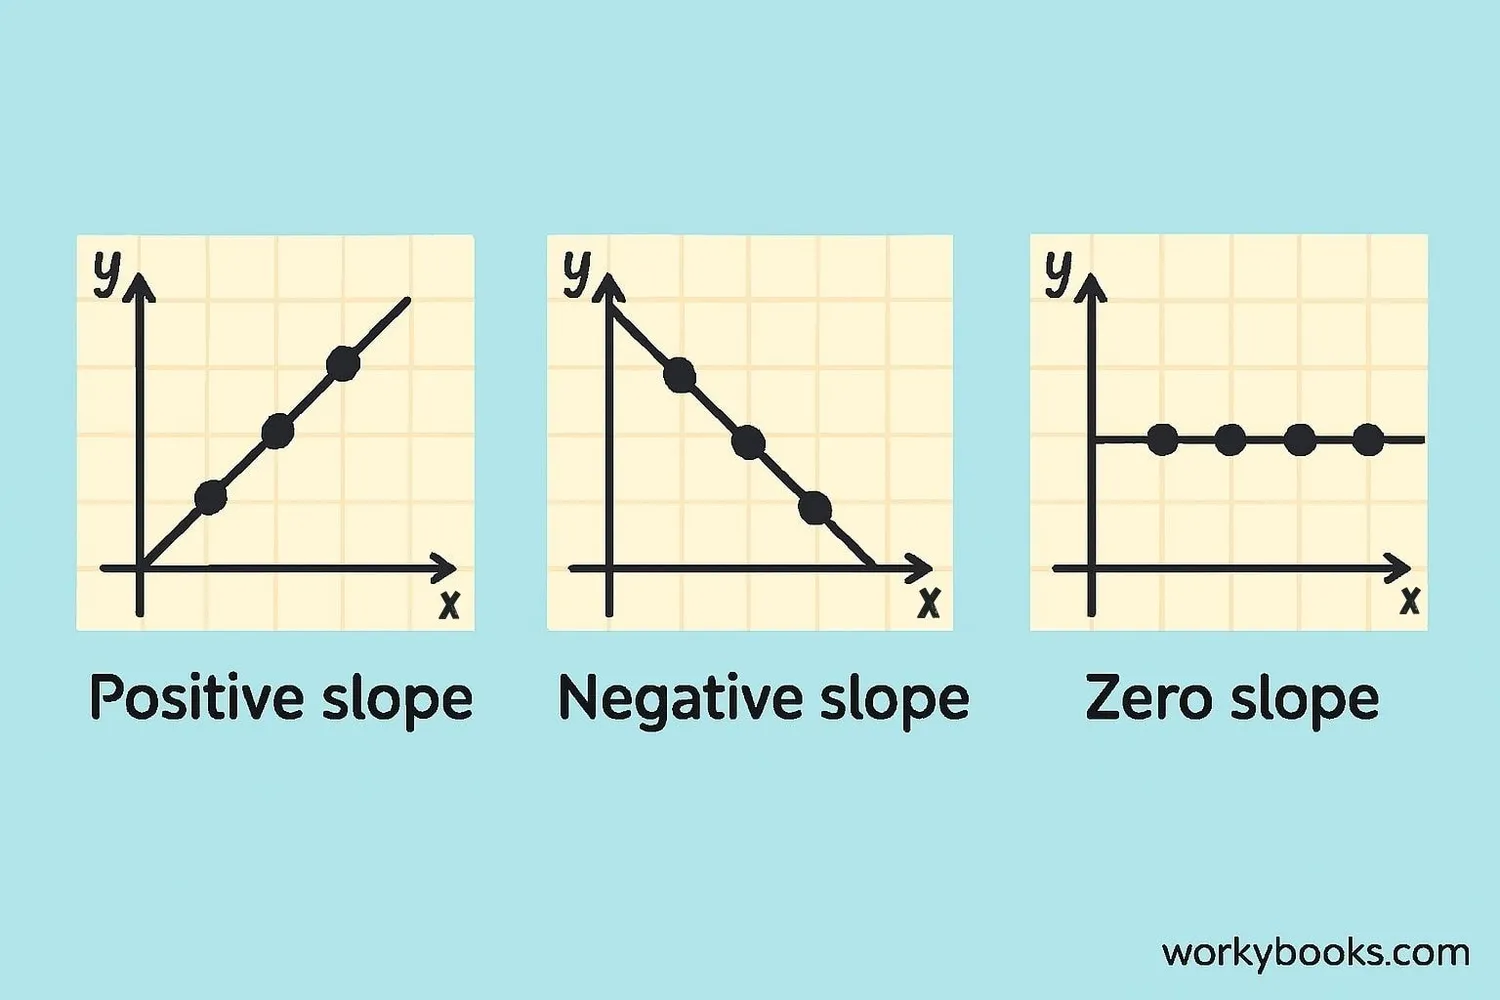
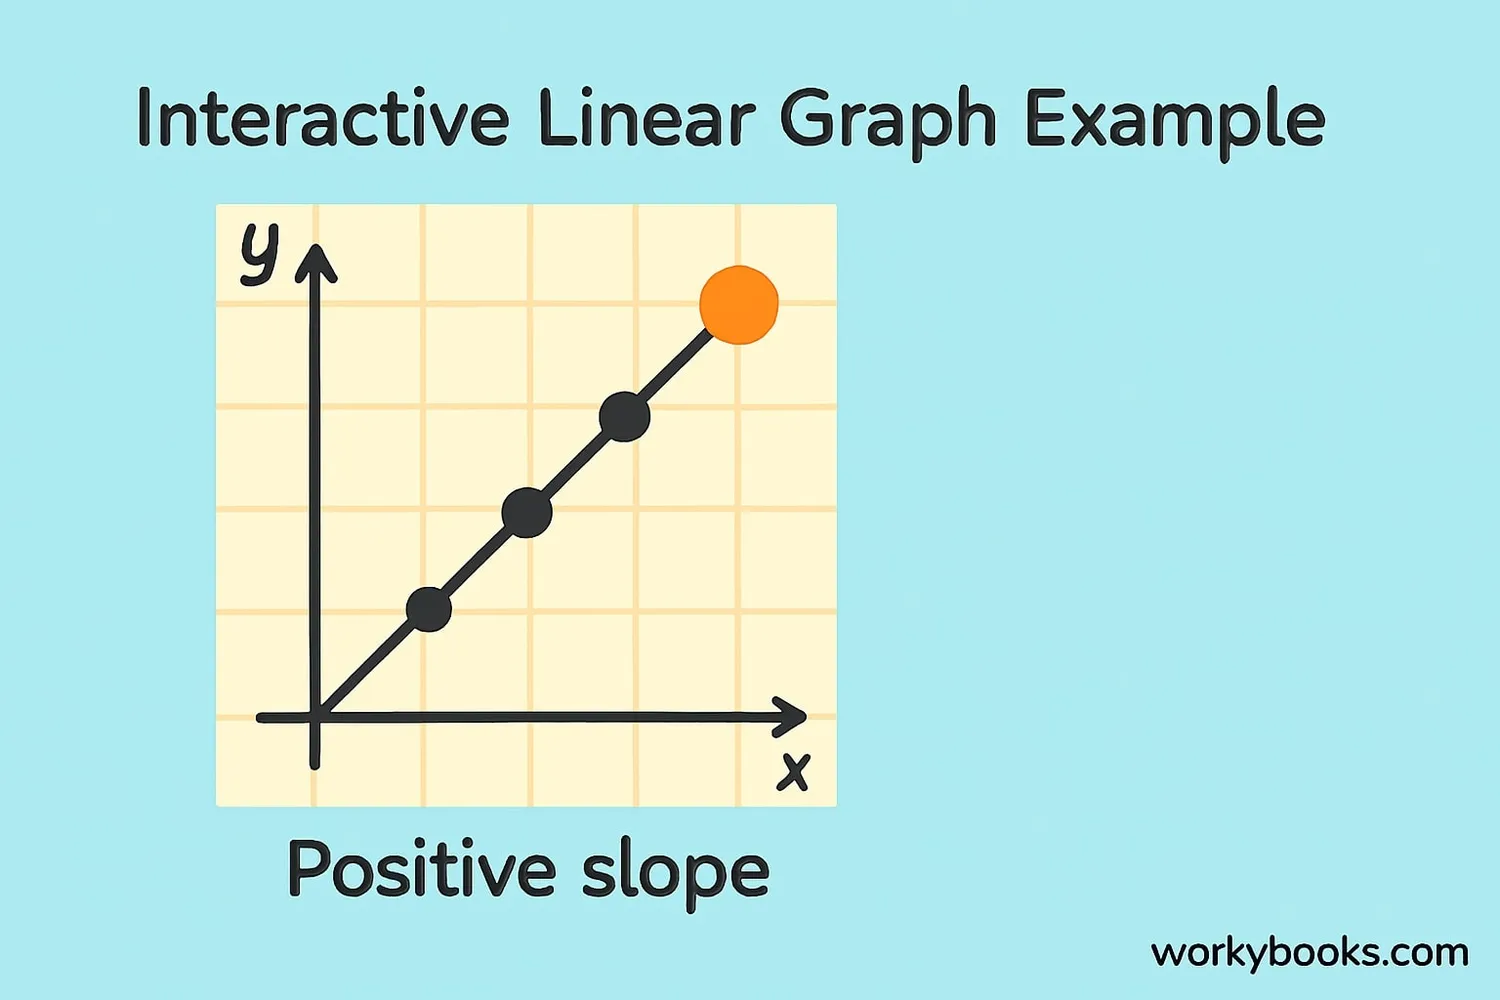
Direction: Does the line go up (positive relationship), down (negative relationship), or stay flat (no relationship)?
Steepness: A steeper line means a faster rate of change. A flatter line means a slower rate of change.
Starting Point: Where does the line cross the y-axis? This tells us the starting value when x is zero.
For example, if a graph shows the relationship between hours practiced and piano pieces learned, a steeper line would mean learning pieces faster, while a flatter line would mean learning more slowly.
Reading Tip
To find a value on the graph, find the point on the x-axis, go straight up to the line, then straight across to the y-axis to read the value.
Real-World Examples
Linear graphs are all around us in everyday life. Here are some examples:
Example 1: Saving money - If you save $5 each week, the graph of your savings over time would be a straight line going up.
Example 2: Distance traveled - If you ride your bike at a steady speed, the graph of distance versus time would be a straight line.
Example 3: Phone bill - If your phone plan charges a fixed rate per minute, the graph of cost versus minutes used would be a straight line.
Example 4: Baking cookies - If each batch requires 2 eggs, the graph of eggs needed versus batches would be a straight line.
Look for patterns in your daily life where one thing changes at a constant rate as another thing changes - these can be shown with linear graphs!
Real-World Connection
Many things in nature and daily life follow linear patterns, which is why learning about linear graphs is so useful.
Linear Graphs Practice Quiz
Test your knowledge about linear graphs with this 5-question quiz. Choose the correct answer for each question.
Frequently Asked Questions
Here are answers to common questions about linear graphs:
Math Trivia
Discover interesting facts about graphs and mathematics:
Ancient Graphs
The concept of graphing relationships dates back to ancient times. The ancient Egyptians used early coordinate systems for land surveying after the Nile River flooded each year.
Graphing in Science
Scientists use linear graphs to show relationships between variables in experiments. If data points form a straight line, it often means they've discovered a simple mathematical relationship.
Real-World Use
Linear graphs are used in many everyday applications like predicting expenses, calculating distances, and even in video games to create realistic movements and animations.
Math Discovery
The coordinate system we use for graphing was invented by French mathematician René Descartes. According to legend, he got the idea while watching a fly crawl on his ceiling!
