
Picture Graphs - Definition, Examples, Quiz, FAQ, Trivia
Learn how to read and create picture graphs to represent data in a visual way!
What is a Picture Graph?
A picture graph is a special way to show information using pictures or symbols instead of just numbers. Each picture in the graph represents a certain number of items. Picture graphs make it easy to understand data at a glance!
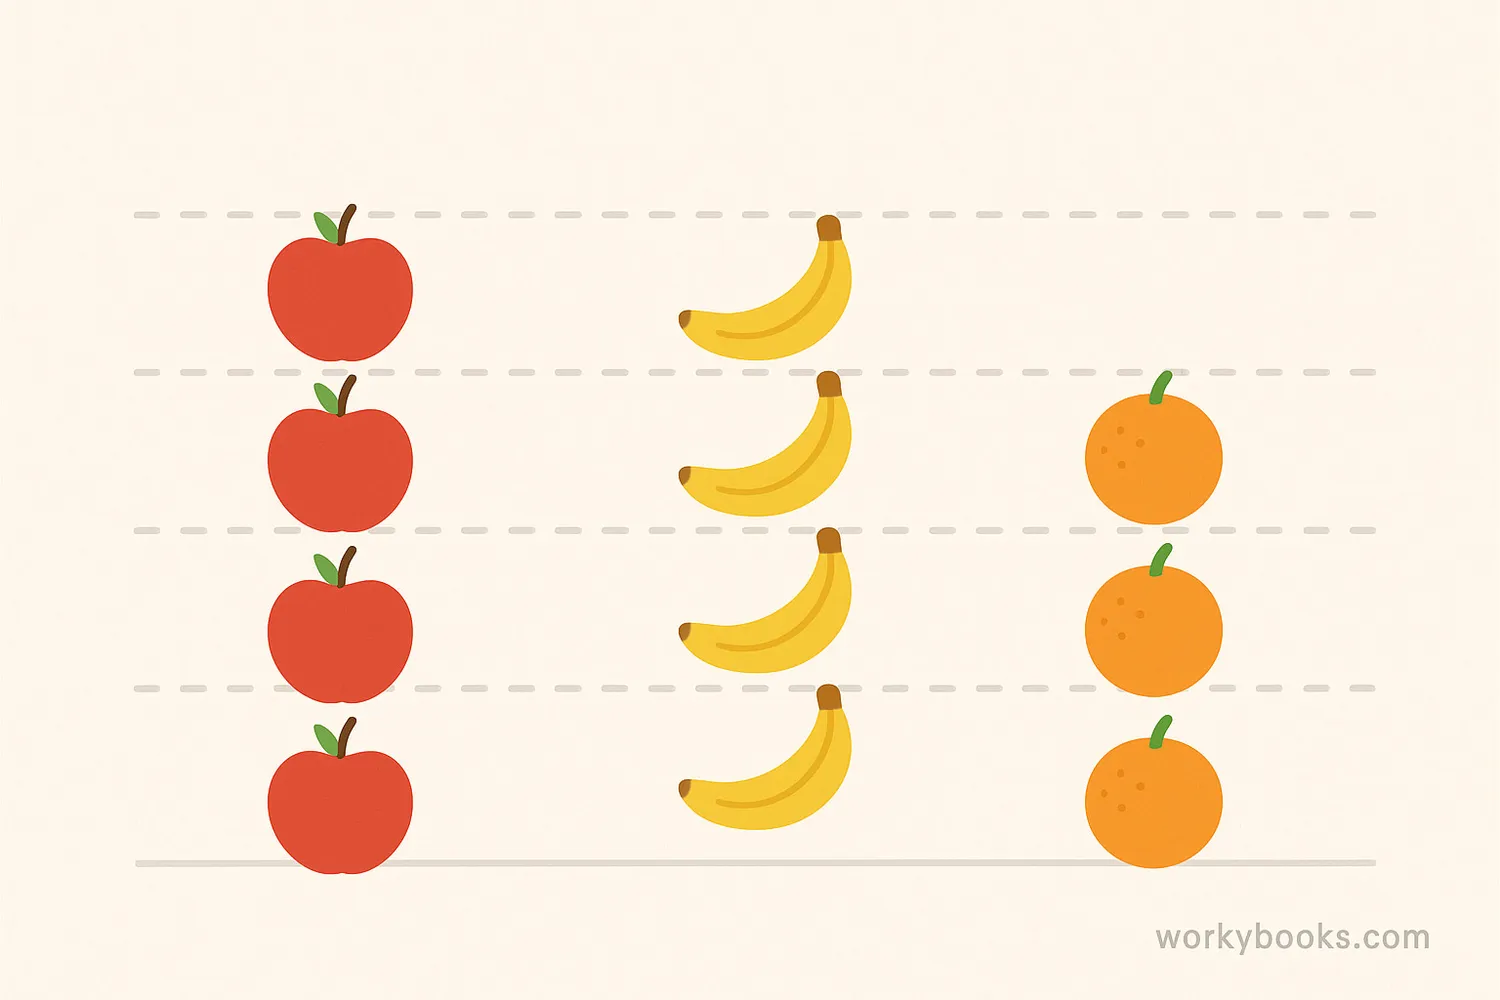
For example, if we're showing how many apples students brought for snack, we might use one apple picture to represent 2 real apples. If we have 4 apple pictures, that would mean 8 apples total!
Math Fact!
Picture graphs are sometimes called pictographs or pictograms. They help us visualize numbers and compare amounts quickly!
Picture Graph vs Pictograph
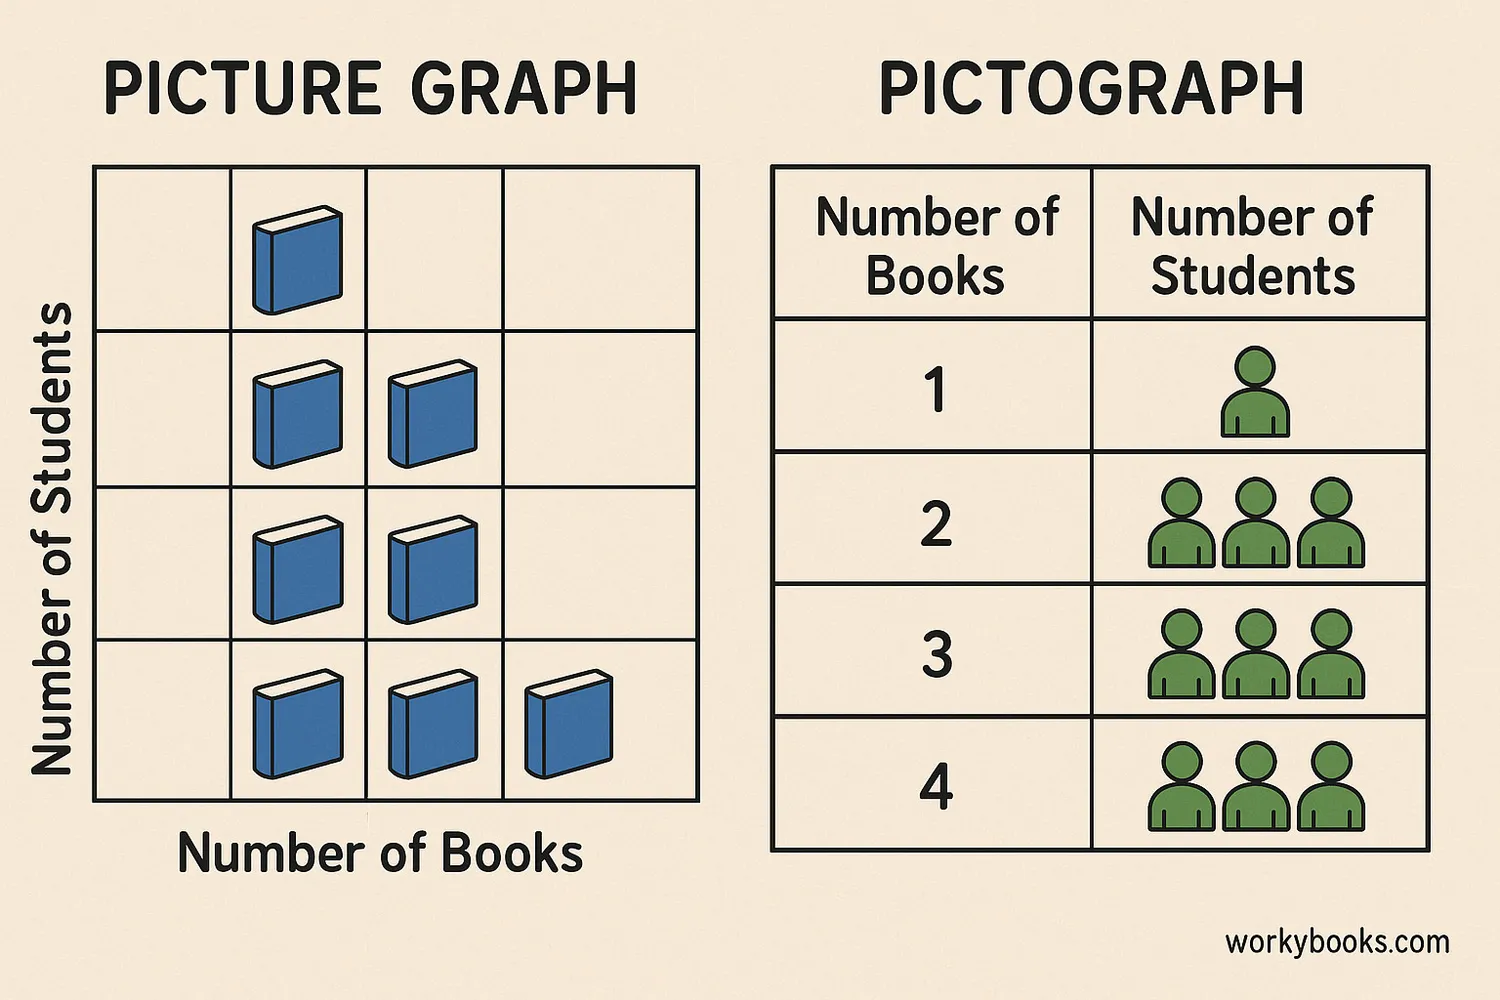
You might hear the terms "picture graph" and "pictograph" used interchangeably. They are very similar, but there's a small difference:
Picture Graph
Uses pictures or symbols to represent data, often with each picture standing for one item
Pictograph
Uses pictures or symbols where each picture might represent more than one item
In practice, many people use these terms to mean the same thing - a graph that uses pictures instead of just numbers. Both help make data more interesting and easier to understand!
How to Read Picture Graphs
Reading a picture graph is like solving a fun puzzle! Here's how to do it:
Look at the Title
The title tells you what information the graph is showing
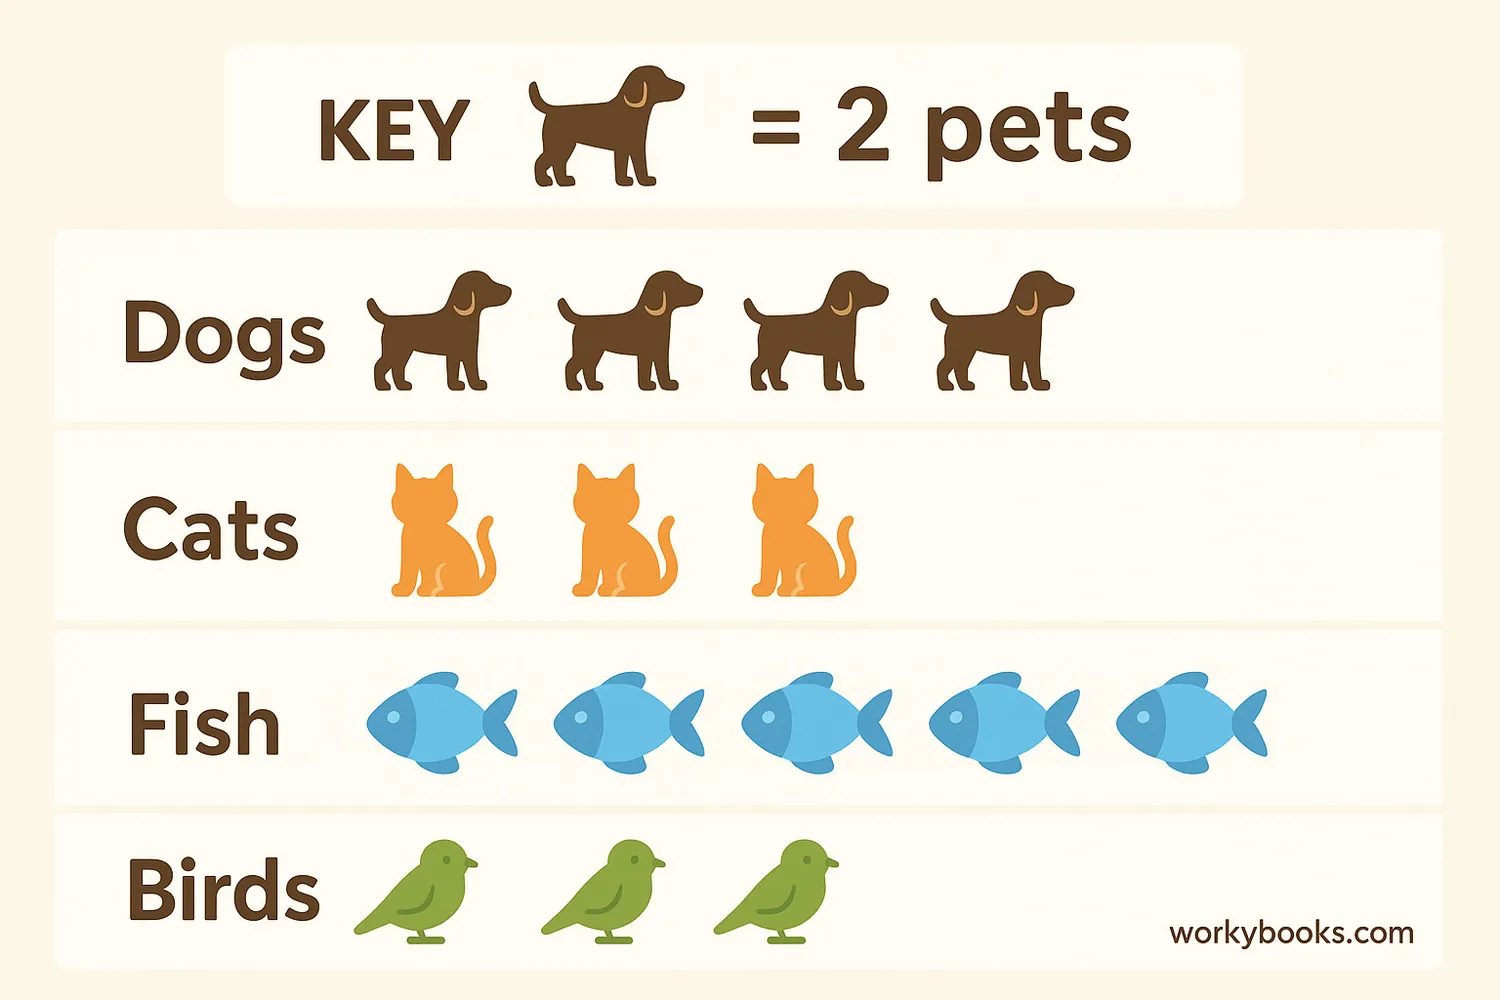
Find the Key
The key shows what each picture represents (like "1 apple = 2 real apples")
Count the Pictures
Count how many pictures are in each row or category
Do the Math
Multiply the number of pictures by what each picture represents
In the example above, each book symbol represents 2 books. Anna has 3 symbols, which means she read 6 books. Ben has 2 symbols (4 books), and Carla has 4 symbols (8 books).
Picture Graph Examples
Picture graphs can be used to show all kinds of information! Here are some common examples:
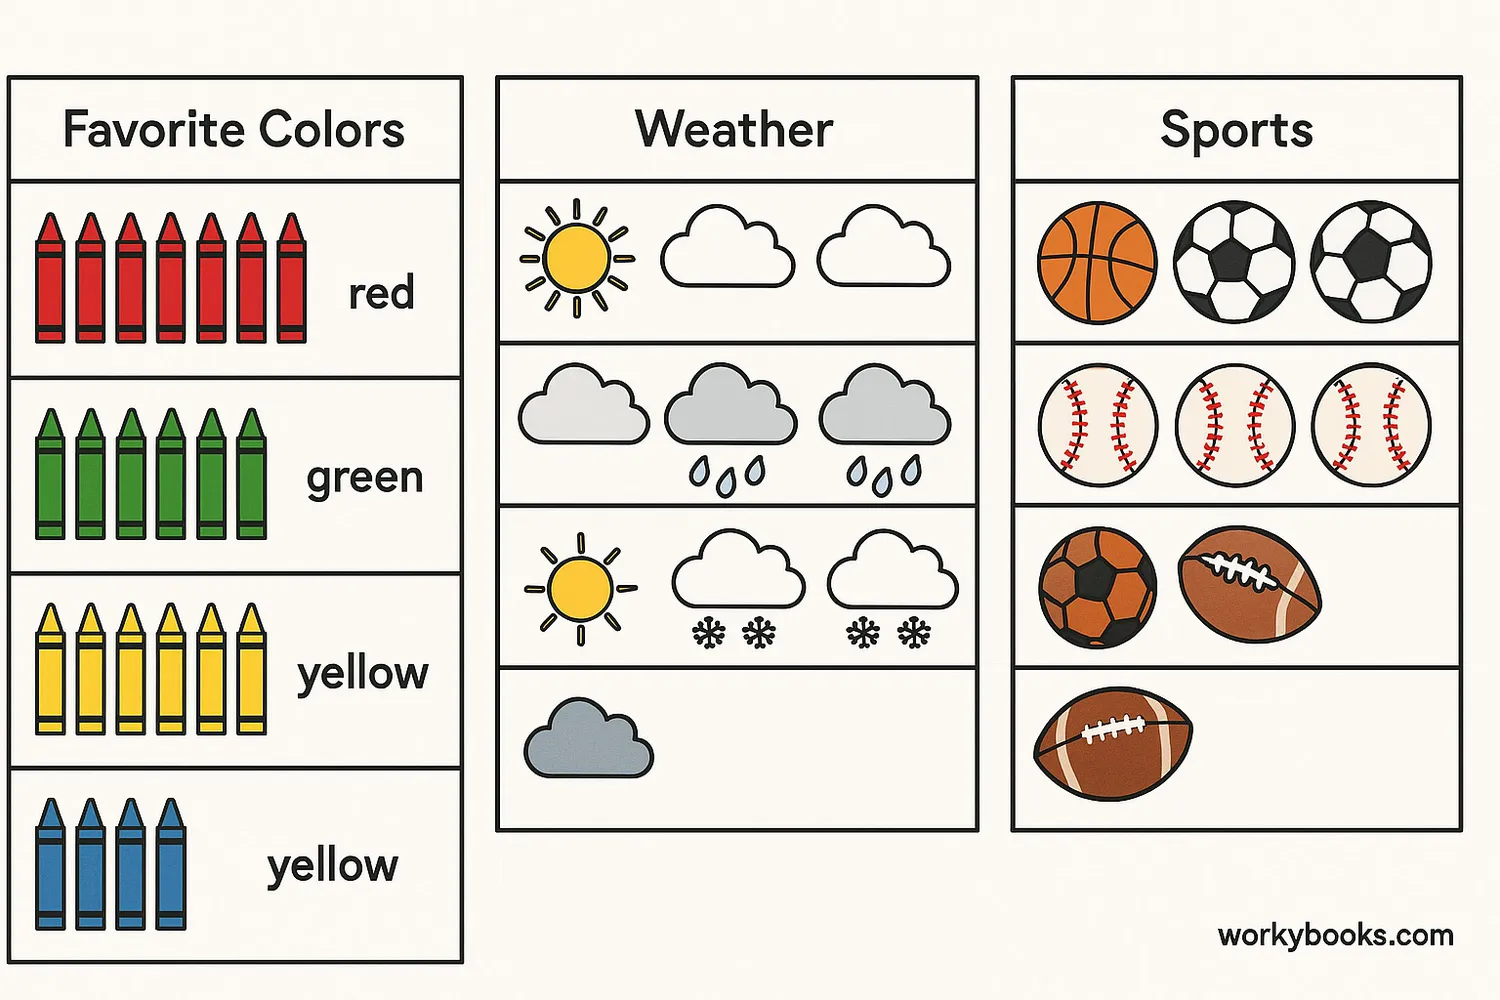
Favorite Foods
Show what foods students like best using pictures of different foods
Weather Data
Track sunny, cloudy, rainy, and snowy days over a month
Class Pets
Show how many students have dogs, cats, fish, or other pets
Reading Progress
Track how many books each student has read during the year
In the example above, we can see that chocolate is the most popular ice cream flavor with 8 students choosing it. Vanilla is the least popular with 5 students, and strawberry has 7 students.
Picture Graph Quiz
Test your picture graph knowledge with this quiz! Answer all 5 questions to see how much you've learned.
Frequently Asked Questions
Here are answers to some common questions about picture graphs:
Math Trivia
Discover some interesting facts about graphs and data!
Ancient Graphs
People have been using visual representations of data for thousands of years! Ancient Egyptians used simple graphs to track harvest yields and inventory.
Graphs in the Real World
Picture graphs aren't just for school! You can find them in newspapers, magazines, and websites showing everything from election results to popular product ratings.
Computer Graphs
Most computer programs that create graphs today started with picture graphs! Early computer systems used simple character-based pictures to represent data before graphics were advanced.
Brain Friendly
Our brains process images much faster than words or numbers. That's why picture graphs can help us understand information more quickly than looking at a list of numbers!
