
Y-Intercept - Definition, Examples, Quiz, FAQ, Trivia
Learn how to find and use the y-intercept in graphing and equations
What is the Y-Intercept?
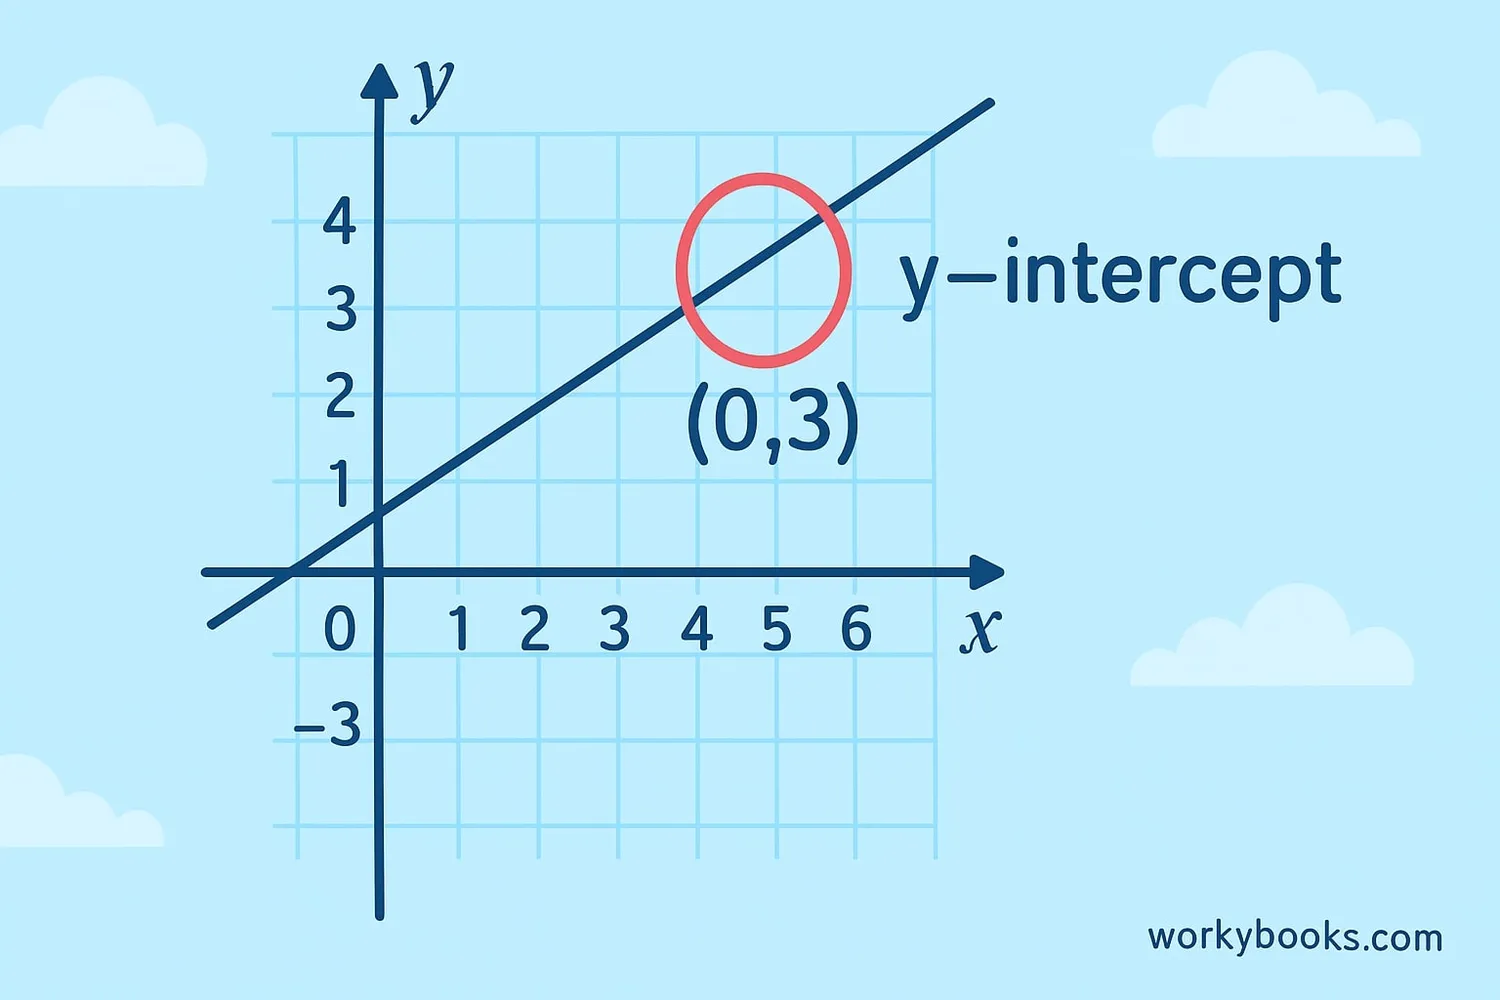
The y-intercept is the point where a line crosses the y-axis on a graph. At this point, the x-value is always 0. It's called the y-intercept because it's where the line "intercepts" (crosses) the y-axis.
Think of it like this: when you start walking along a straight path, the y-intercept is where you began before you took your first step to the right or left. It's your starting point on the graph!
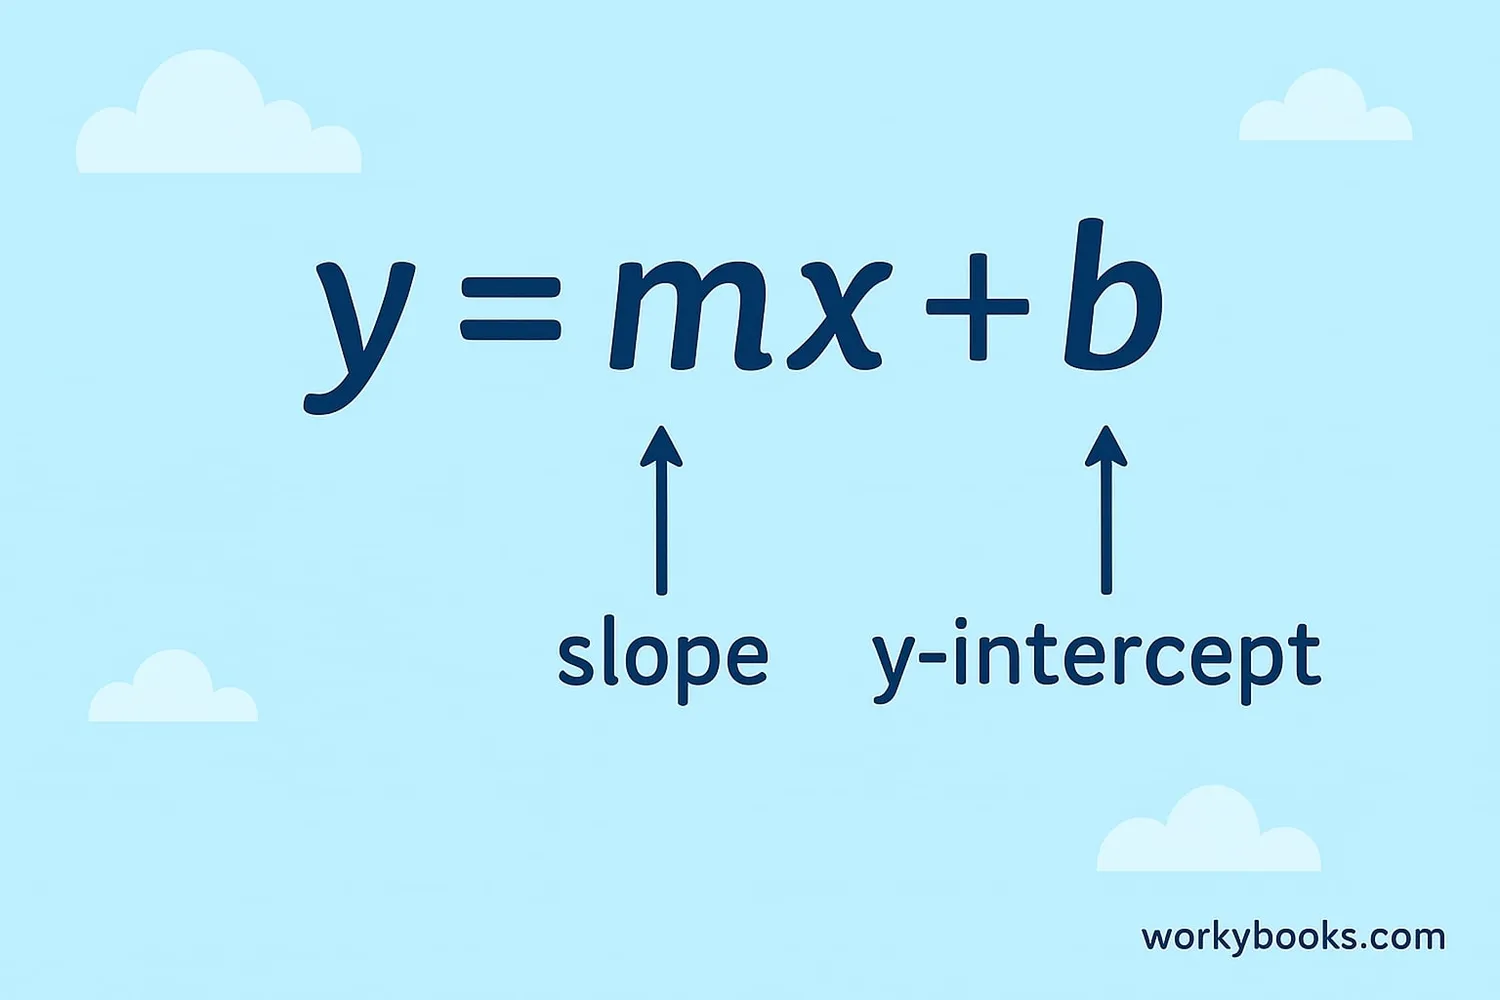
In the equation of a line, the y-intercept is represented by the letter b in the slope-intercept form: y = mx + b.
Key Concept
The y-intercept is always written as (0, b) because x is always 0 at the y-intercept point.
Y-Intercept Formula
The most common way to represent the y-intercept is in the slope-intercept form of a linear equation:
Slope-Intercept Form
Where:
• m is the slope (steepness) of the line
• b is the y-intercept (where it crosses the y-axis)
Example 1: y = 2x + 3
The y-intercept (b) is 3, so the line crosses the y-axis at (0, 3)
Example 2: y = -x + 5
The y-intercept (b) is 5, so the line crosses the y-axis at (0, 5)
Example 3: y = 4x
There's no b shown, but that means b = 0, so the line crosses at (0, 0)
Remember
In the equation y = mx + b, the y-intercept is always the constant term (the number without an x).
How to Find the Y-Intercept
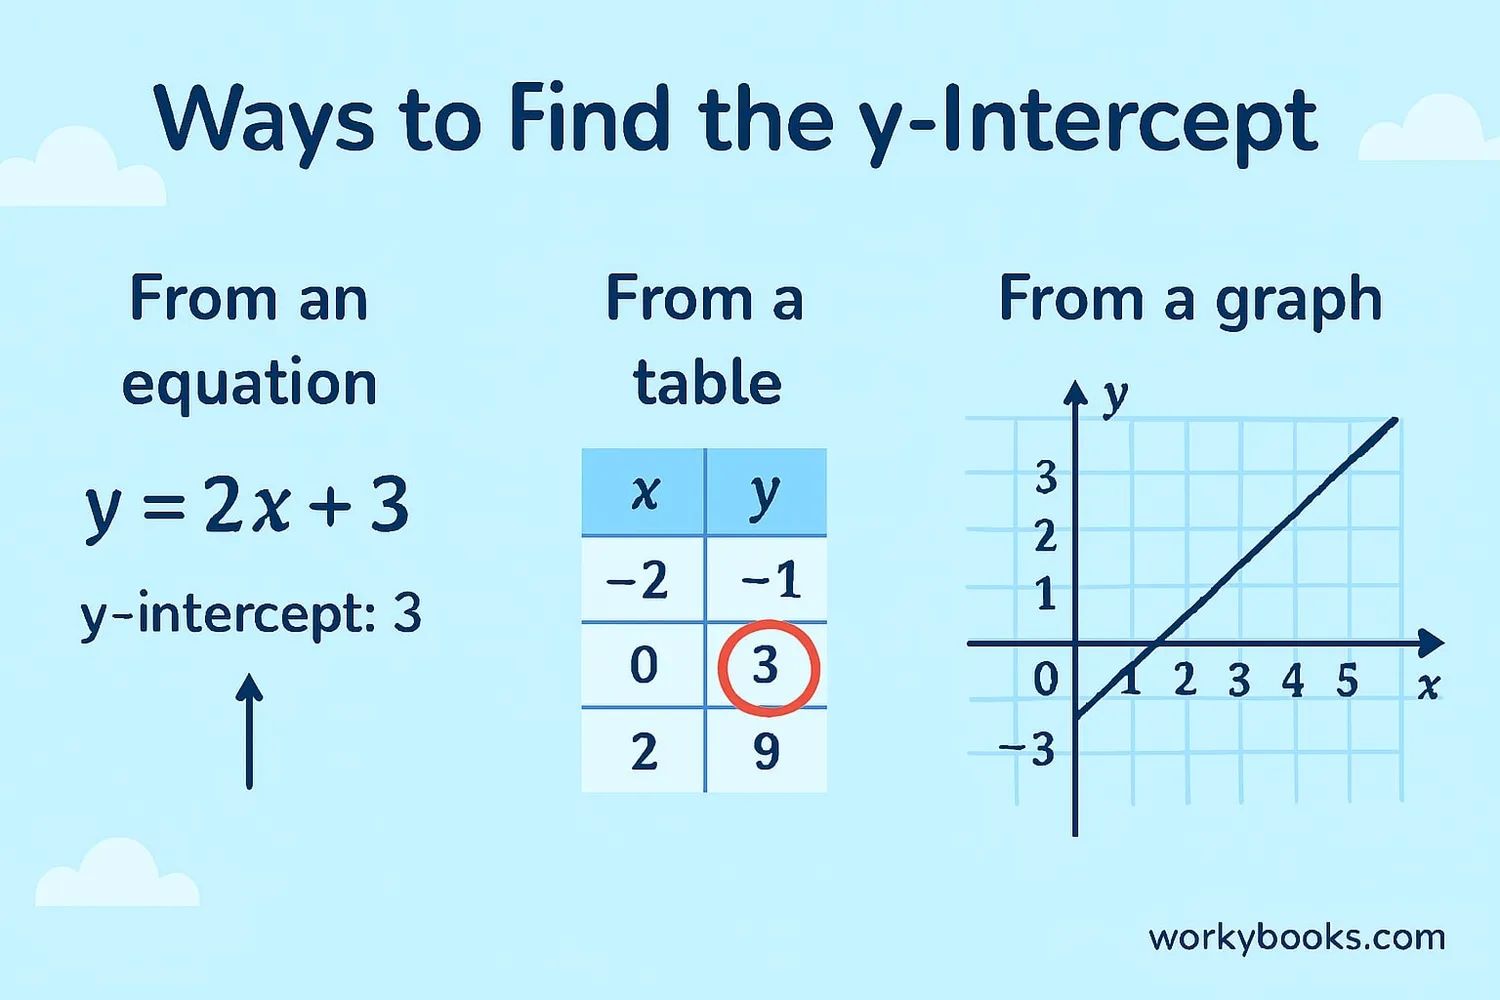
There are several ways to find the y-intercept:
1. From an equation:
- If the equation is in slope-intercept form (y = mx + b), b is the y-intercept
- If not, set x = 0 and solve for y
- Look for the row where x = 0
- The y-value in that row is the y-intercept
- Find where the line crosses the y-axis
- That point is the y-intercept (0, b)
Example: Find the y-intercept of 2x + 3y = 6
Step 1: Set x = 0 → 2(0) + 3y = 6
Step 2: Solve for y → 3y = 6 → y = 2
Step 3: The y-intercept is (0, 2)
Tip
When x=0, all the terms with x disappear, making it easy to solve for y!
Y-Intercept on Graphs
On a graph, the y-intercept is easy to spot - it's where the line crosses the vertical y-axis. Let's look at some examples:
Positive y-intercept: When the line crosses the y-axis above the origin (0,0). For example, (0, 4)
Negative y-intercept: When the line crosses the y-axis below the origin. For example, (0, -2)
Zero y-intercept: When the line passes through the origin (0,0)
Special case - horizontal lines: A horizontal line has equation y = b. Its y-intercept is (0, b) and it has no x-intercept.
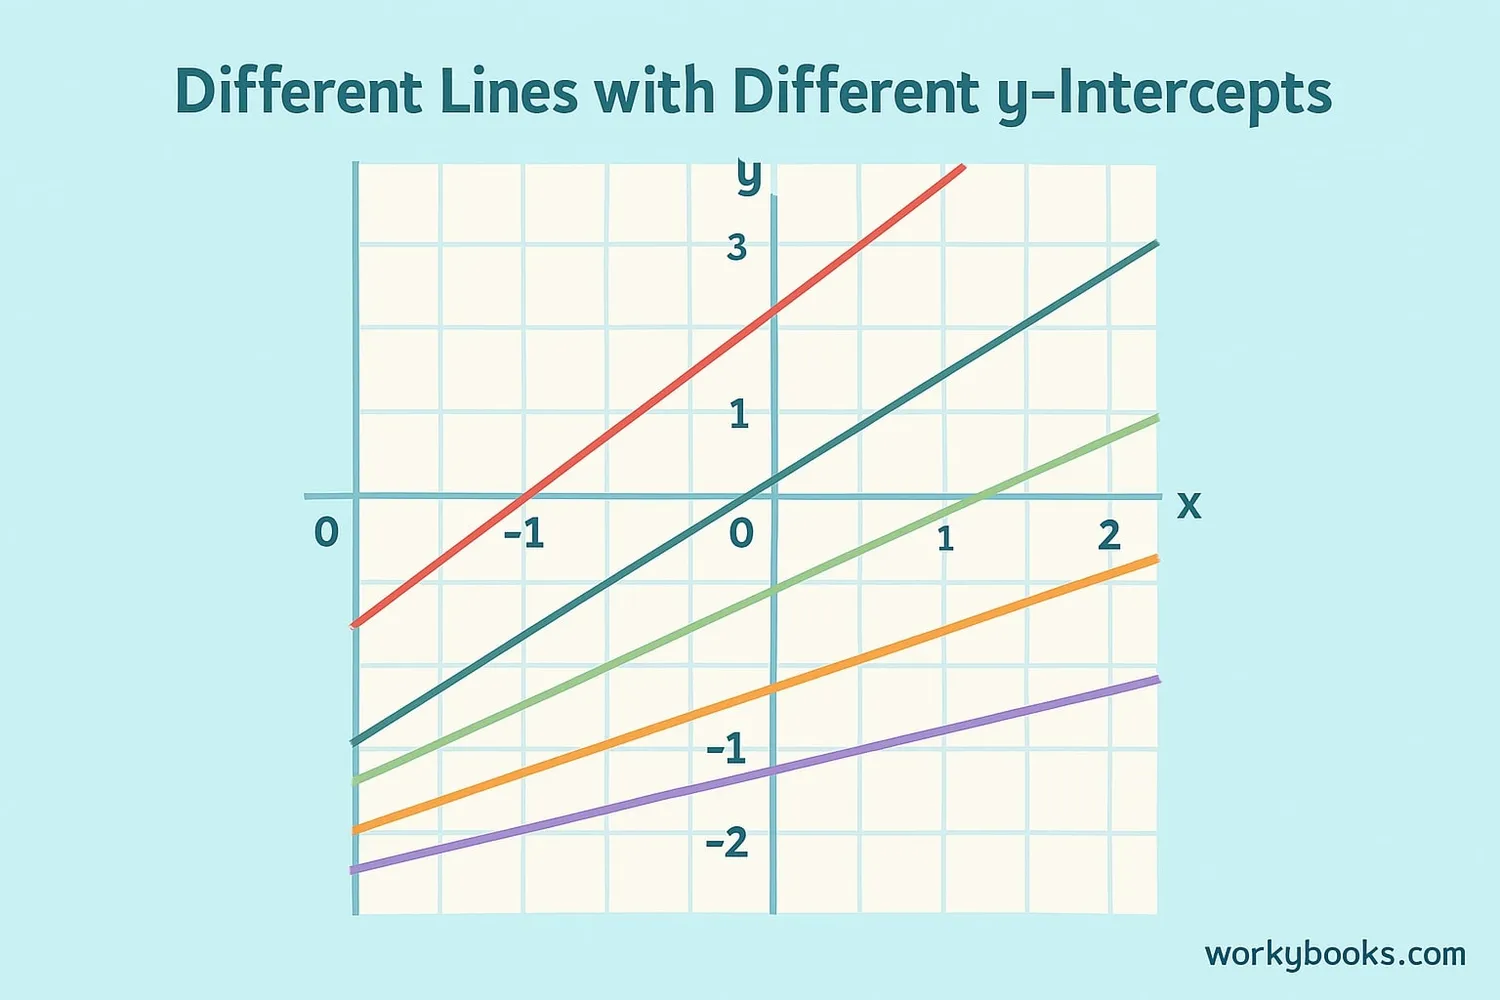
Graph Reading Practice:
Look at the graph above. Can you find the y-intercepts for each line? Remember to look where each line crosses the y-axis!
Graph Tip
Even if the graph doesn't show x=0, you can imagine extending the line to see where it would cross the y-axis.
Y-Intercept in Quadratic Functions
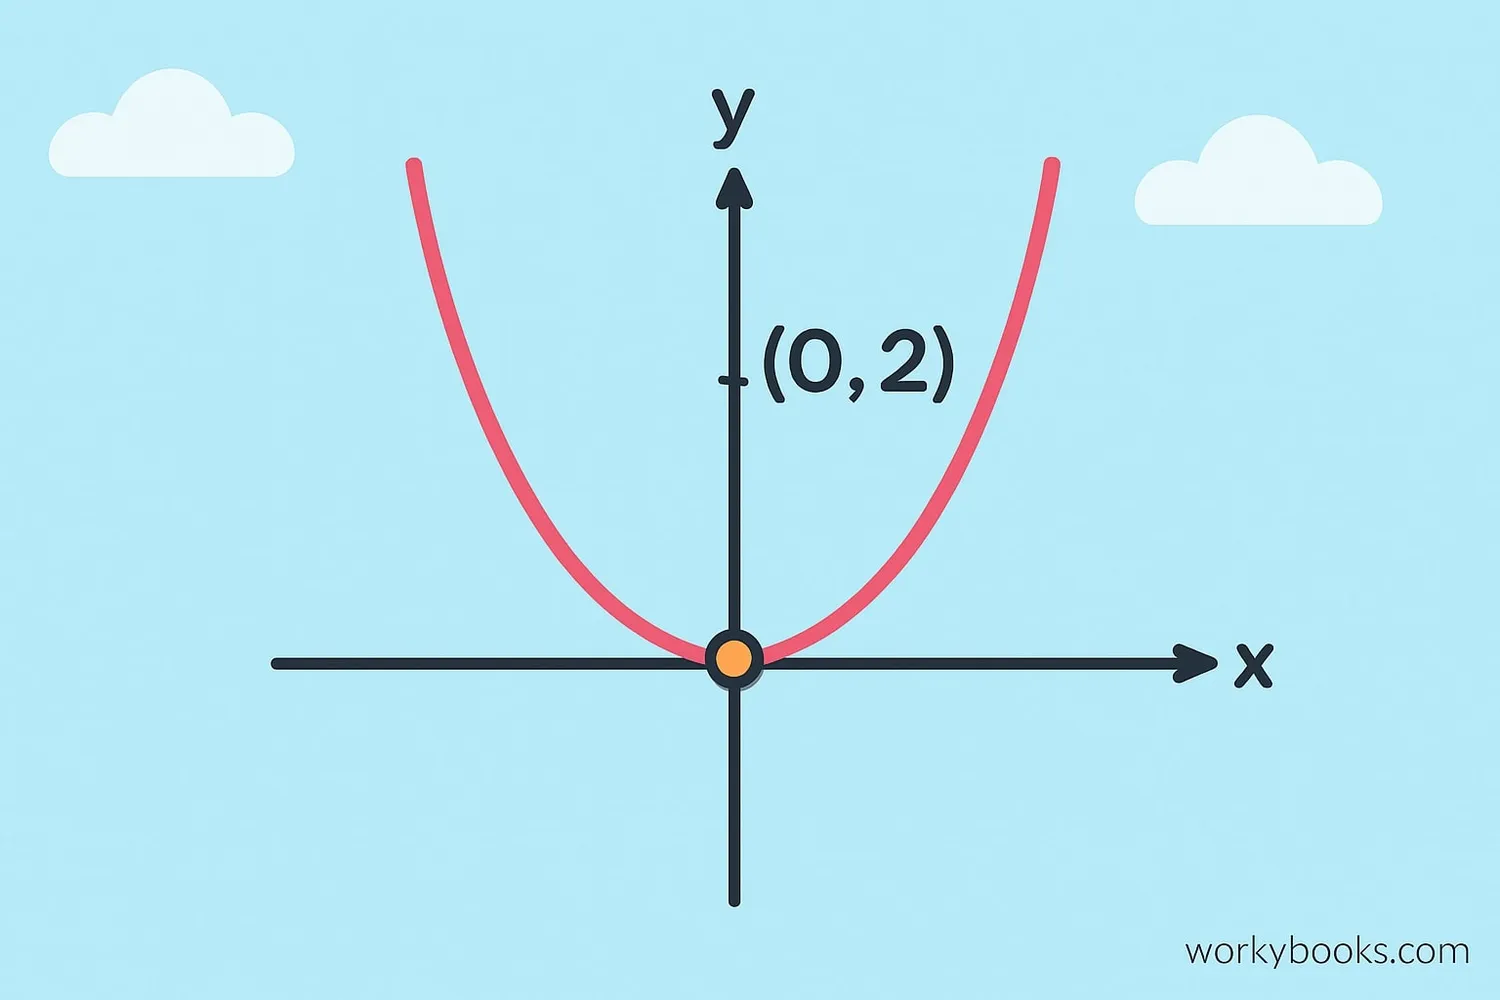
Quadratic functions (which make parabolas on graphs) also have y-intercepts! The good news is that finding the y-intercept for a quadratic function works exactly the same way as for linear functions:
Set x = 0 and solve for y!
For a quadratic equation in standard form: y = ax² + bx + c
The y-intercept is always the constant term c, because when you set x=0:
y = a(0)² + b(0) + c = c
So the y-intercept is (0, c)
Example: Find the y-intercept of y = 2x² - 3x + 5
Set x = 0: y = 2(0)² - 3(0) + 5 = 5
So the y-intercept is (0, 5)
Quadratic Tip
While a parabola can have 0, 1, or 2 x-intercepts, it always has exactly one y-intercept!
Y-Intercept Practice Quiz
Test your understanding with this 5-question quiz. Choose the correct answer for each question.
Frequently Asked Questions
Here are answers to common questions about the y-intercept:
Math Trivia
Discover interesting facts about graphing and algebra:
Origin of Coordinates
The coordinate system we use today is called the Cartesian coordinate system, named after French mathematician René Descartes who developed it in the 17th century.
Real-World Applications
Y-intercepts are used in many real-world situations! In business, the y-intercept might represent fixed costs before producing any items. In science, it could represent an initial quantity before an experiment begins.
Graphing in Space
NASA scientists use 3-dimensional coordinate systems to plot the position of spacecraft. In these systems, there are actually three intercepts: x-intercept, y-intercept, and z-intercept!
Largest Graph
The largest mathematical graph ever created had over 5 billion points! It was used to model internet connections around the world. Each point represented a computer and connections were the lines.
