3rd Grade Finding Patterns in a Bar Graph
Interactive worksheet with auto-grading, instant feedback, and printable PDF.
By completing this purchase you agree to our Terms of Use and Privacy Policy. Your subscription renews automatically until you cancel. You can cancel anytime from your account settings. All sales are final and non-refundable. Digital content is available for download in your account immediately upon purchase.
What's included
3rd Grade Finding Patterns in a Bar Graph preview and details
About this worksheet
3rd Grade Finding Patterns in a Bar Graph Worksheet (Analyzing Data, TEKS 3.2B)
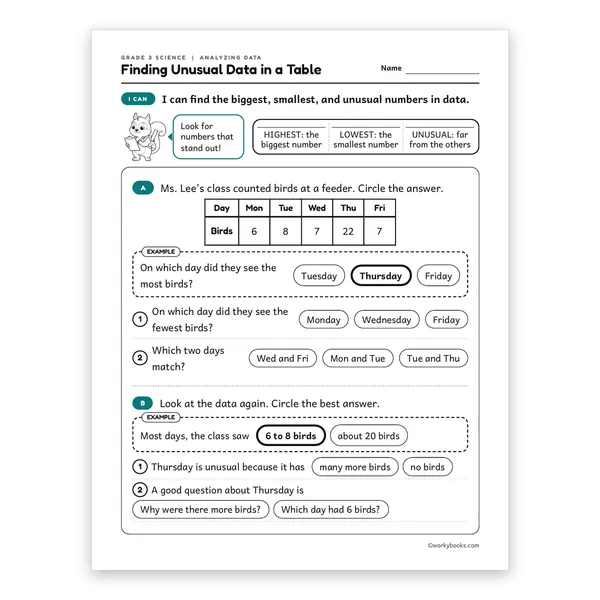
Students read a bar graph of real average high temperatures for Austin, Texas, find the hottest month, see that the bars go up then down, and spot two months that are about the same. Simple black and white doodles and big, easy to read text keep the focus on the thinking, not the reading. No prior knowledge is needed: the page teaches the idea first.
What's Inside
- A teach strip on bars that go up, go down, or stay the same
- Part A: read a real Austin temperature bar graph and circle answers, with a worked example
- Part B: find months that are about the same and the hottest season
- A friendly squirrel guide that points out the key idea
- A visual answer key with answers marked in red, plus a short teacher note
How Teachers Use It
Use it as a mini lesson follow up, a quick check, or a science center. It takes 6 to 8 minutes and prints clearly in black and white. The focus skill is analyzing data to find patterns, part of the grade 3 scientific and engineering practices.
Why It Works
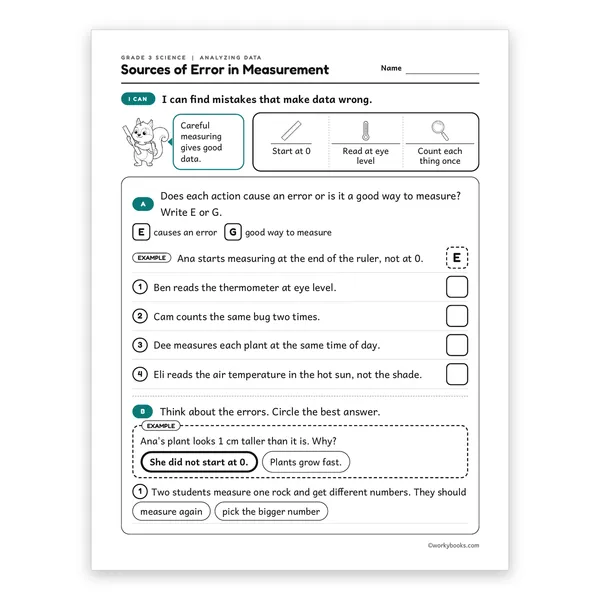
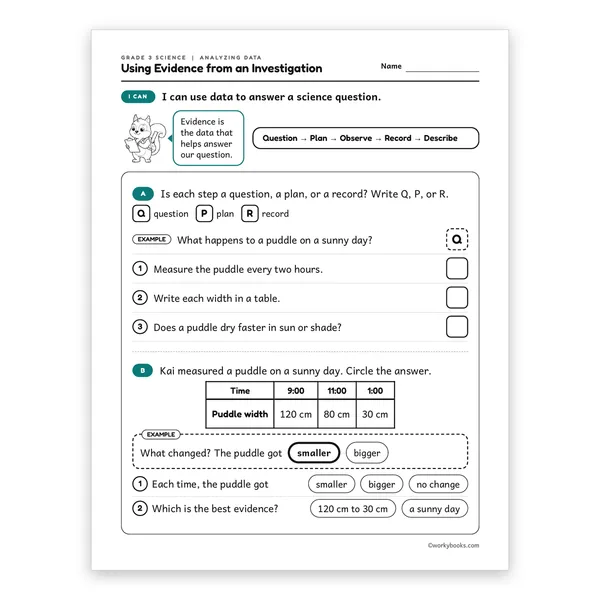
Each sheet teaches one idea first, then asks students to use only what the page taught. Every activity has a done for you example, and students only circle, sort, or write a letter, so they can finish on their own. Wrong choices are believable, not silly, so students have to think. Pair it with the other Analyzing Data sheets to cover models, patterns, unusual data, sources of error, evidence, math comparisons, and design criteria.
Perfect for the way you teach
- Assign in one click
- Track progress per student
- Auto-graded results
- Practice at home
- Print or do on-screen
- Build skill mastery
- Standards-aligned
- Self-paced
- Ready-to-use today