Graph the Temperature Data
Interactive worksheet with auto-grading, instant feedback, and printable PDF.
- Format
- Interactive (Online), Printable (PDF)
- Grades
- 345
- Subjects
- science
- Standards
- NGSS 3-ESS2-1
What's included
About this worksheet
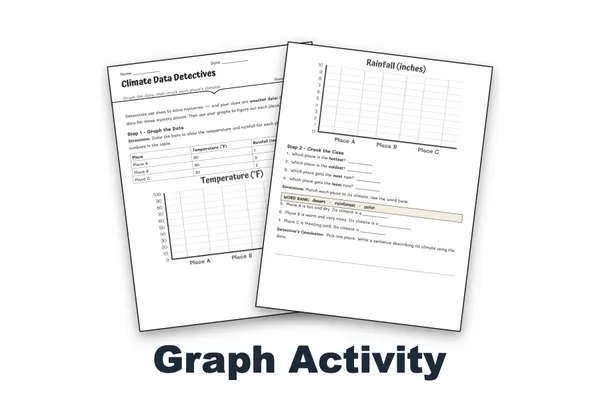
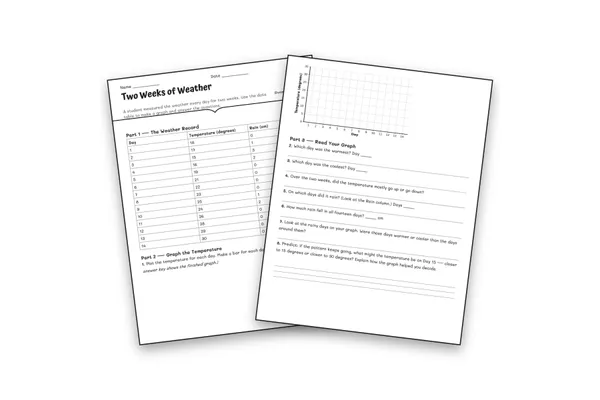
Give students a dataset and a grid, and let them build the graph. This Grade 3 worksheet provides a five-day temperature dataset and a blank bar-graph grid, then has students plot each day and interpret what the graph shows.
The activity opens with a predict-first prompt, then students draw a bar for each day on a clearly labeled temperature scale. Four interpretation questions build from reading the graph (warmest and coolest day, the temperature difference) to describing the pattern and a reasoning question that connects the rising temperatures to a likely season.
Aligned directly to NGSS 3-ESS2-1, this sheet has students represent data in a graphical display and describe what it shows. The clean dataset lands exactly on gridlines, so plotting is accurate and frustration-free.
Your download includes a printable worksheet with a blank grid and an answer key that shows the completed graph with every bar plotted, plus sample answers. No prep required.
Ideal for a graphing lesson, data-analysis practice, or assessment.
Perfect for the way you teach
- Assign in one click
- Track progress per student
- Auto-graded results
- Practice at home
- Print or do on-screen
- Build skill mastery
- Standards-aligned
- Self-paced
- Ready-to-use today