Two Weeks of Weather
Interactive worksheet with auto-grading, instant feedback, and printable PDF.
- Format
- Interactive (Online), Printable (PDF)
- Grades
- 345
- Subjects
- science
- Standards
- NGSS 3-ESS2-1
What's included
About this worksheet
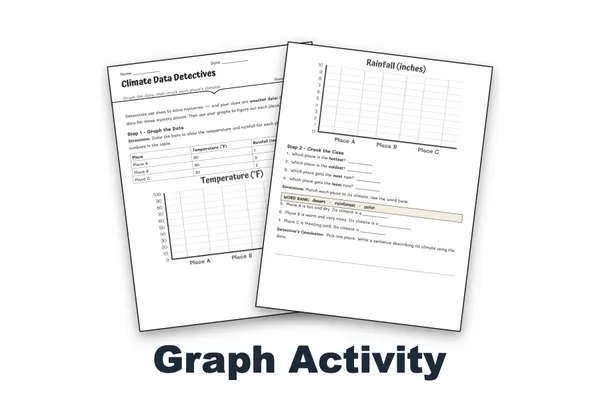
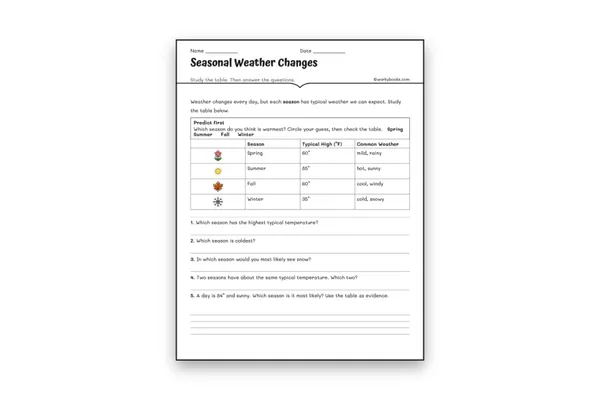
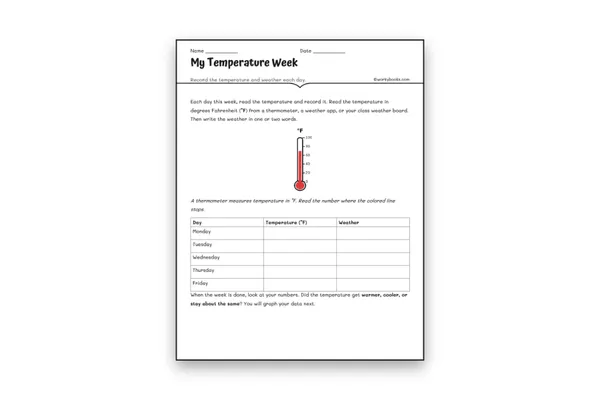
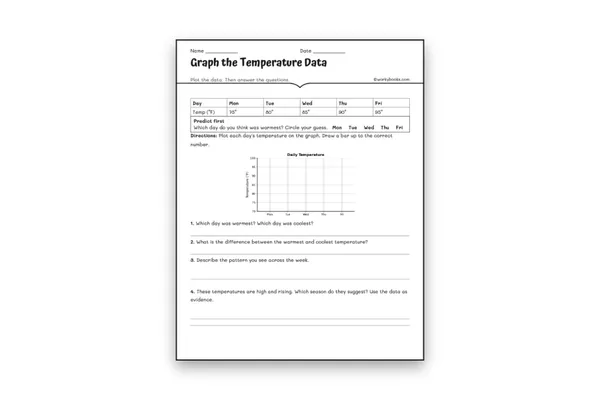
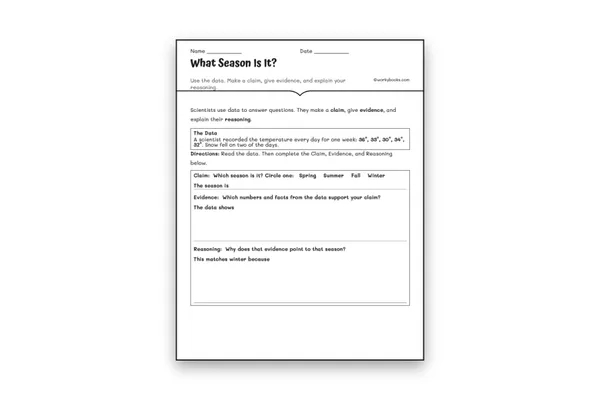
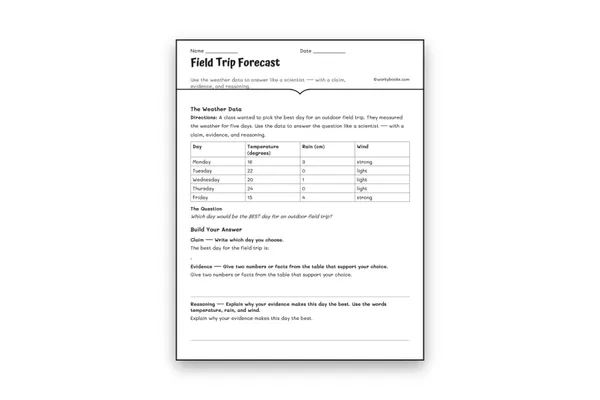
Put weather data to work with this graphing and interpretation activity for grades 3-5. Students study a 14-day weather record, build a bar graph of the daily temperature, and then read their graph to answer real questions.
The interpretation questions ask students to find the warmest and coolest days, describe the two-week trend, total the rainfall, and notice that rainy days ran cooler than the days around them. A final prediction question has students use the pattern to forecast the next day and explain their thinking with evidence from the graph.
The included answer key shows the finished, plotted reference graph so grading is fast and clear. This activity is the data spine of a weather measurement unit and mirrors a real two-week weather-tracking project.
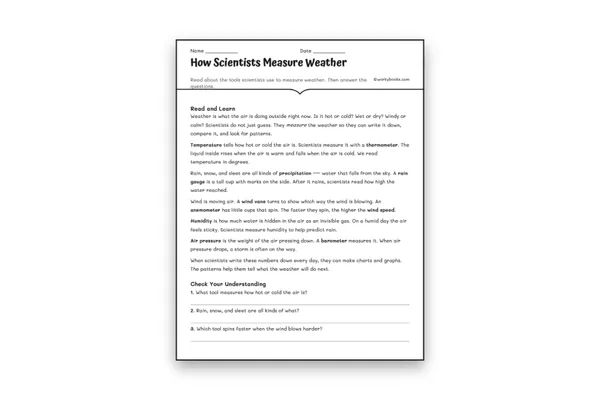
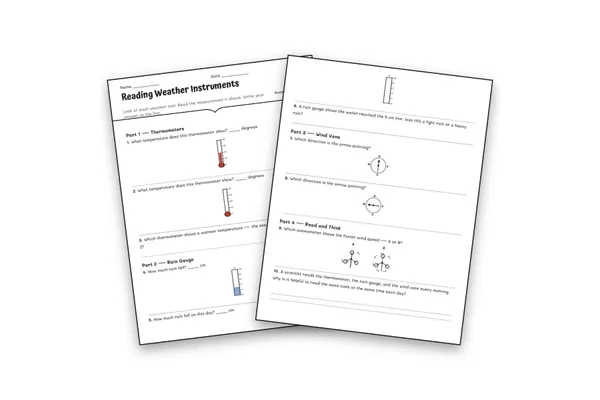
Aligned to NGSS 3-ESS2-1, it moves students from plotting to interpreting to predicting. Pair it with the instrument-reading worksheet and the claim-evidence-reasoning capstone in the series. Just print and teach.
Perfect for the way you teach
- Assign in one click
- Track progress per student
- Auto-graded results
- Practice at home
- Print or do on-screen
- Build skill mastery
- Standards-aligned
- Self-paced
- Ready-to-use today