Graphing Hurricane Wind Speeds
Interactive worksheet with auto-grading, instant feedback, and printable PDF.
By completing this purchase you agree to our Terms of Use and Privacy Policy. Your subscription renews automatically until you cancel. You can cancel anytime from your account settings. All sales are final and non-refundable. Digital content is available for download in your account immediately upon purchase.
What's included
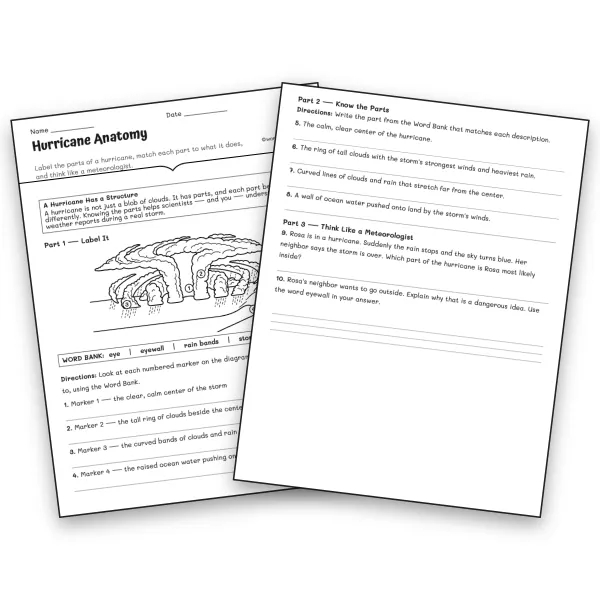
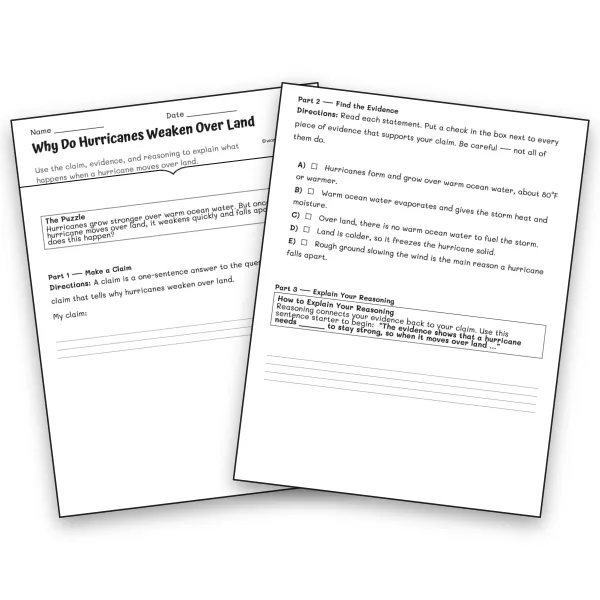
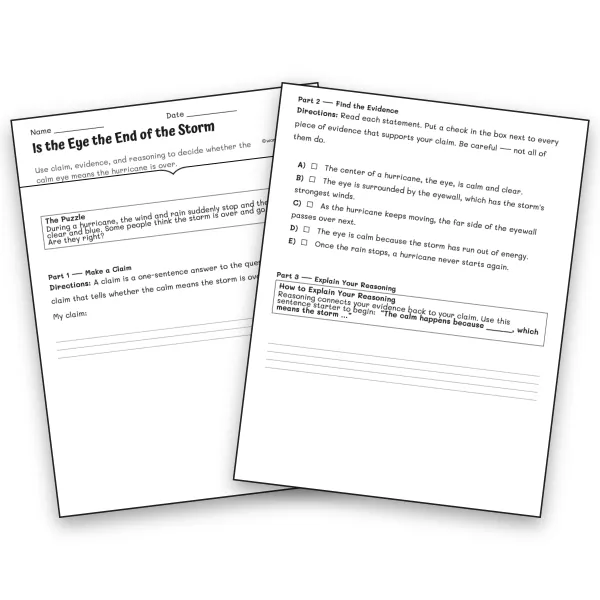
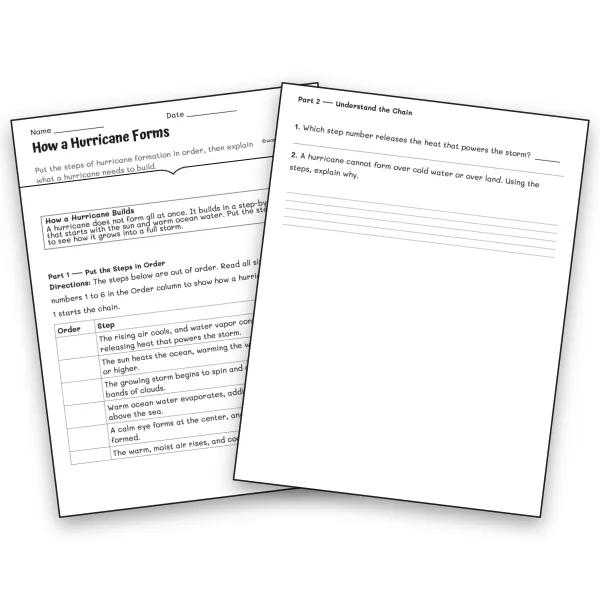
Graphing Hurricane Wind Speeds preview and details
About this worksheet
Turn hurricane data into real science thinking with this scaffolded graphing worksheet built for middle school students in grades 6-8. Students graph the landfall wind speeds of nine famous hurricanes, classify each storm using the Saffir-Simpson Scale, and analyze what the scale does and does not measure.
This is a true data-analysis activity, not a fill-in-the-blank page. Learners work from a blank bar-graph grid, plot real wind-speed values, and then use category thresholds to sort each storm from Category 1 to Category 5. A Predict-First prompt builds inquiry before the graphing begins, and the closing analysis questions target a powerful misconception: that Hurricane Katrina's Category 3 landfall means the scale measures total damage. It does not.
What's included: a one-to-two page student worksheet, a data table of historic hurricanes, a blank graphing grid, and a complete answer key featuring the fully plotted reference graph with category-threshold lines drawn in.
Skills covered: reading and building bar graphs, interpreting data, hurricane categories, wind speed, and evidence-based reasoning. Aligned to NGSS MS-ESS3-2. Print and teach, or use in a station or sub-plan. A perfect fit for a severe weather, natural hazards, or meteorology unit.
Perfect for the way you teach
- Assign in one click
- Track progress per student
- Auto-graded results
- Practice at home
- Print or do on-screen
- Build skill mastery
- Standards-aligned
- Self-paced
- Ready-to-use today