Percentages and Averages
Interactive worksheet with auto-grading, instant feedback, and printable PDF.
By completing this purchase you agree to our Terms of Use and Privacy Policy. Your subscription renews automatically until you cancel. You can cancel anytime from your account settings. All sales are final and non-refundable. Digital content is available for download in your account immediately upon purchase.
What's included
Percentages and Averages preview and details
About this worksheet
Percentages and Averages Worksheet (Grade 6 Science, TEKS 6.2C)
Show grade 6 students how scientists use everyday math to study living things. This one-page reading and activity sheet teaches population, percent, and mean with a simple example, then has students work with bird and frog counts.
What's Inside
- A short reading on populations, percent (part divided by whole, times 100), and mean, with a Key Words note
- Activity 1, Part A: Students find what percent of 50 birds at a feeder were sparrows, pigeons, finches, and robins
- Activity 1, Part B: Students find the total and mean of a five-day frog count
- Activity 2: Three true or false sentences that use their answers
- A visual answer key with answers marked in red
How Teachers Use It
Use it in an ecology unit, as a math and science connection, or as practice for TEKS 6.2C. Every step is shown on the page, so students know exactly what to do. The sheet takes about 10 minutes and prints clearly in black and white.
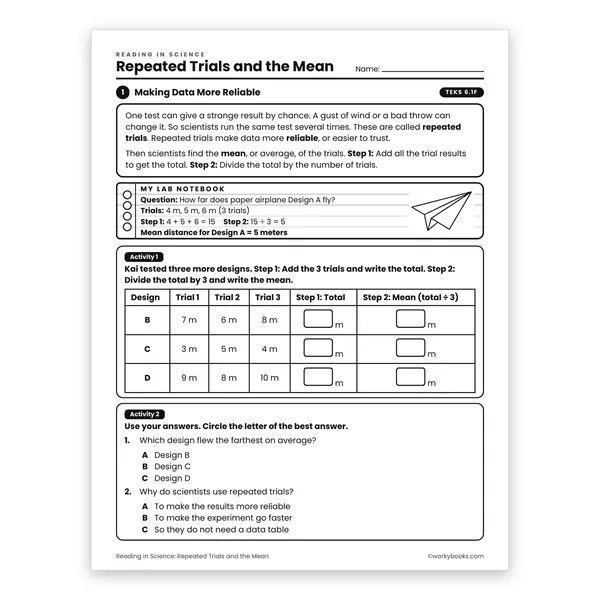
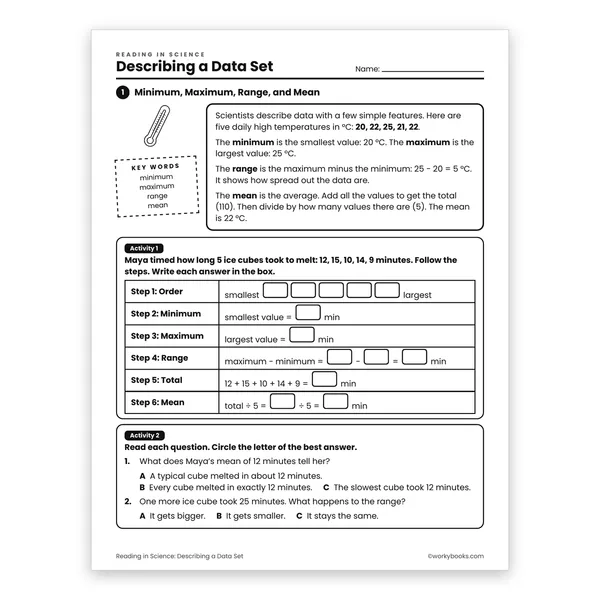
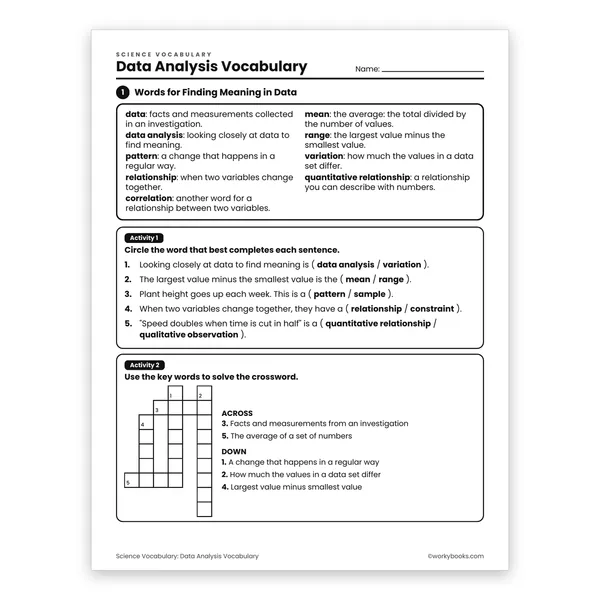
This worksheet is part of the Reading in Science series for grade 6. It supports TEKS 6.2C: use mathematical calculations to assess quantitative relationships in data. Pair it with the other data analysis sheets in the series to build a short unit on working with data.
Why It Works
Each sheet teaches the key terms in plain words first, then asks students to use only what the page taught. Every calculation is laid out step by step in a table, so students build confidence while the answer key lets teachers check work fast. The clean layout is also easy to project for a whole-class review.
Perfect for the way you teach
- Assign in one click
- Track progress per student
- Auto-graded results
- Practice at home
- Print or do on-screen
- Build skill mastery
- Standards-aligned
- Self-paced
- Ready-to-use today