
Which Changed More?
Interactive worksheet with auto-grading, instant feedback, and printable PDF.
By completing this purchase you agree to our Terms of Use and Privacy Policy. Your subscription renews automatically until you cancel. You can cancel anytime from your account settings. All sales are final and non-refundable. Digital content is available for download in your account immediately upon purchase.
What's included
Which Changed More? preview and details
About this worksheet
Which Changed More? Worksheet: Calculating and comparing changes (Grade 4 Science, TEKS 4.2C)
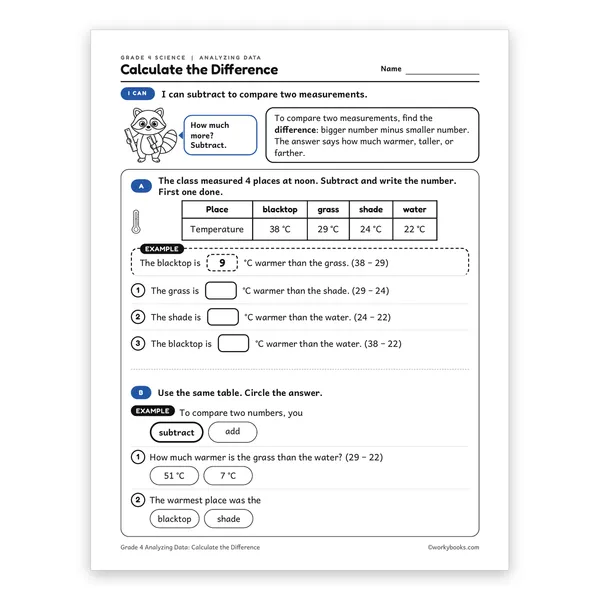
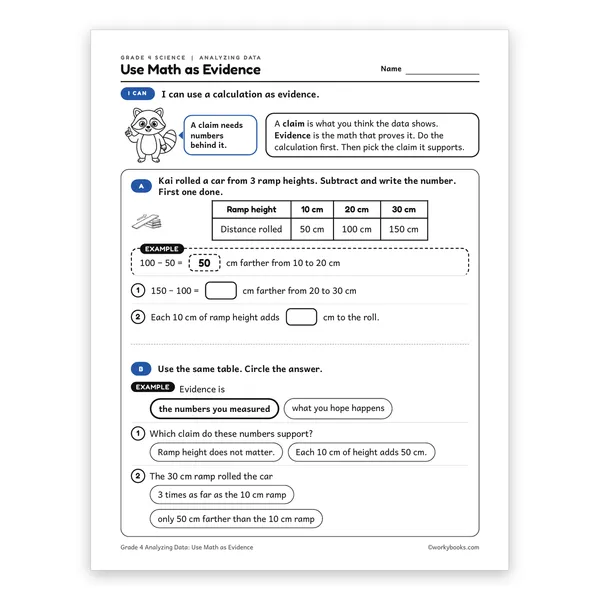
Students read a table of three ice cubes that all started at 30 grams, finish the change column with the subtraction printed in each cell, then circle which cube changed the most and why. The page teaches the skill first, so no prior lesson is needed, and every student task is sort, circle, or fill in. One sheet is one page, with two short parts and nothing to write from scratch.
What's Inside
- A short teach box on finding a change
- A three cube table with the change column to finish, first one done
- Part B: three circle the answer questions, first one done
- A visual answer key with answers marked in red, plus a short teacher note with what to watch for
How Teachers Use It
Each sheet follows the same three steps: read the short teach box, work the sort with the first item done for you, then answer three quick questions with the first one done for you. It takes 6 to 8 minutes and prints clearly in black and white. The focus skill is calculating and comparing changes, part of TEKS 4.2C: analyze and interpret data to derive meaning, identify features and patterns, and discover relationships or trends.
Why It Works
These sheets teach children how to read and analyse data, not test what they know. Every answer is readable from the data printed on the page: the numbers sit on the bars, the sizes sit under the pictures, and the equations sit beside the boxes. Each sheet stays inside one investigation, every question is one step, and wrong choices are believable, not silly. Pair it with the other eleven Grade 4 Analyzing Data sheets to cover models, patterns, conclusions, errors, calculations, and design criteria.
Perfect for the way you teach
- Assign in one click
- Track progress per student
- Auto-graded results
- Practice at home
- Print or do on-screen
- Build skill mastery
- Standards-aligned
- Self-paced
- Ready-to-use today