Summarize numerical data sets in relation to their context, such as by:
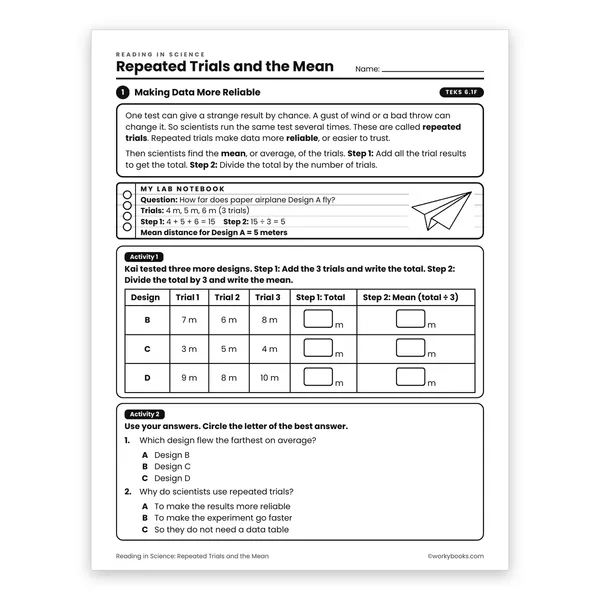
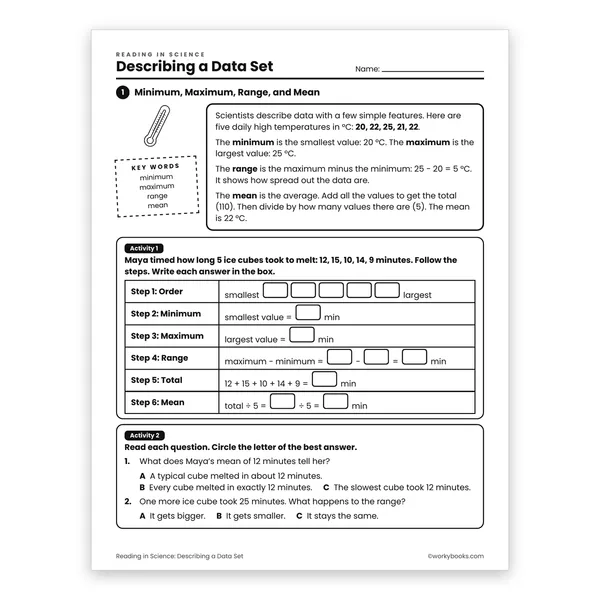
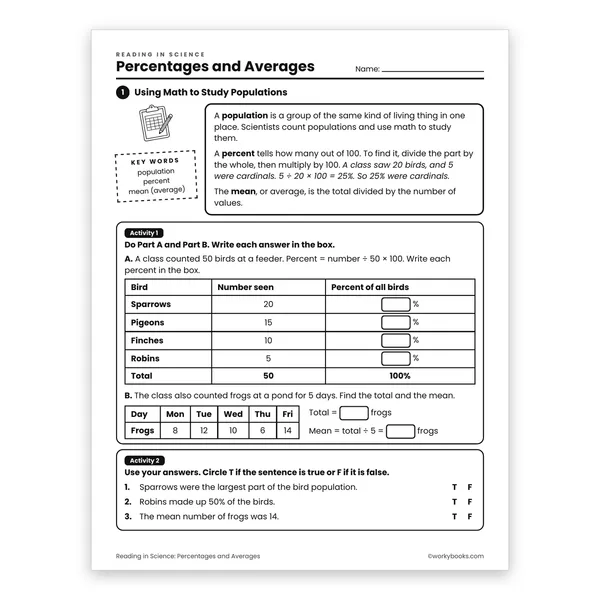
- Reporting the number of observations.
- Describing the nature of the attribute under investigation, including how it was measured and its units of measurement.
- Relating the choice of measures of center and variability to the shape of the data distribution and the context in which the data were gathered.
- Giving quantitative measures of center (median and/or mean) and variability (interquartile range and/or mean absolute deviation), as well as describing any overall pattern and any striking deviations from the overall pattern with reference to the context in which the data were gathered.