
Statistics - Definition, Examples, Quiz, FAQ, Trivia
Learn about data, graphs and numbers with simple explanations, examples and quizzes
What is Statistics?
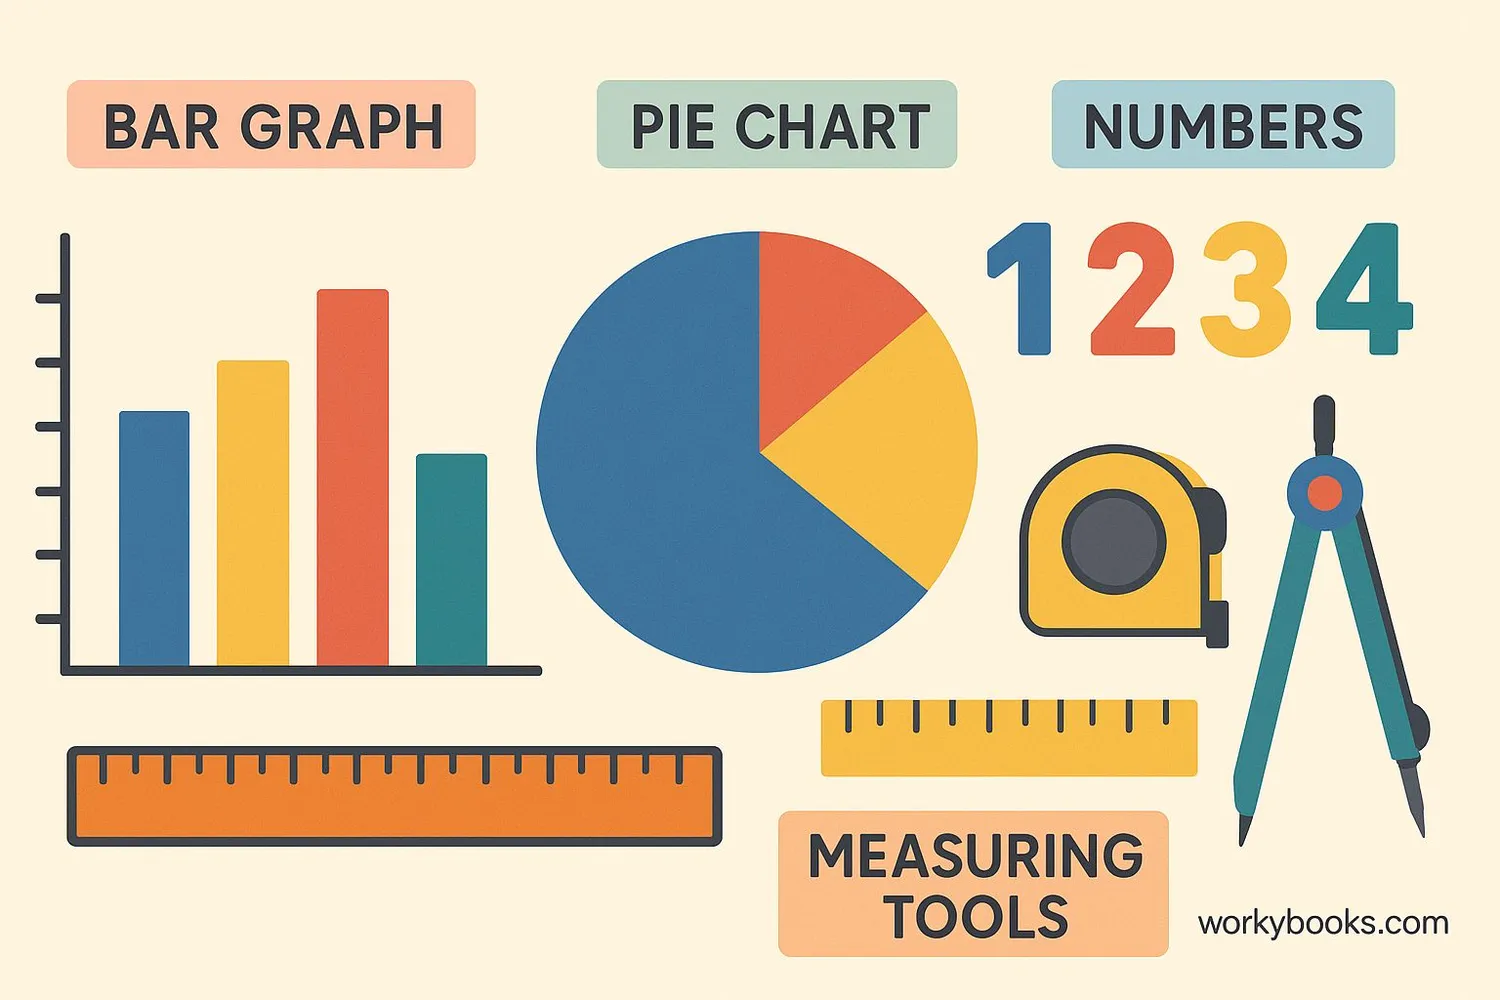
Statistics is the science of collecting, organizing, analyzing, and interpreting data (information). It helps us understand patterns in numbers and make good decisions.
We use statistics every day without realizing it! When you count how many students like pizza vs. hamburgers, or measure how tall your classmates are, you're doing statistics.
Statistics helps answer questions like:
- What is the average height of 3rd graders?
- How many pets do most families have?
- What is the most popular ice cream flavor in our class?
Key Concept
Statistics turns numbers into useful information that helps us understand the world.
Data Collection & Organization
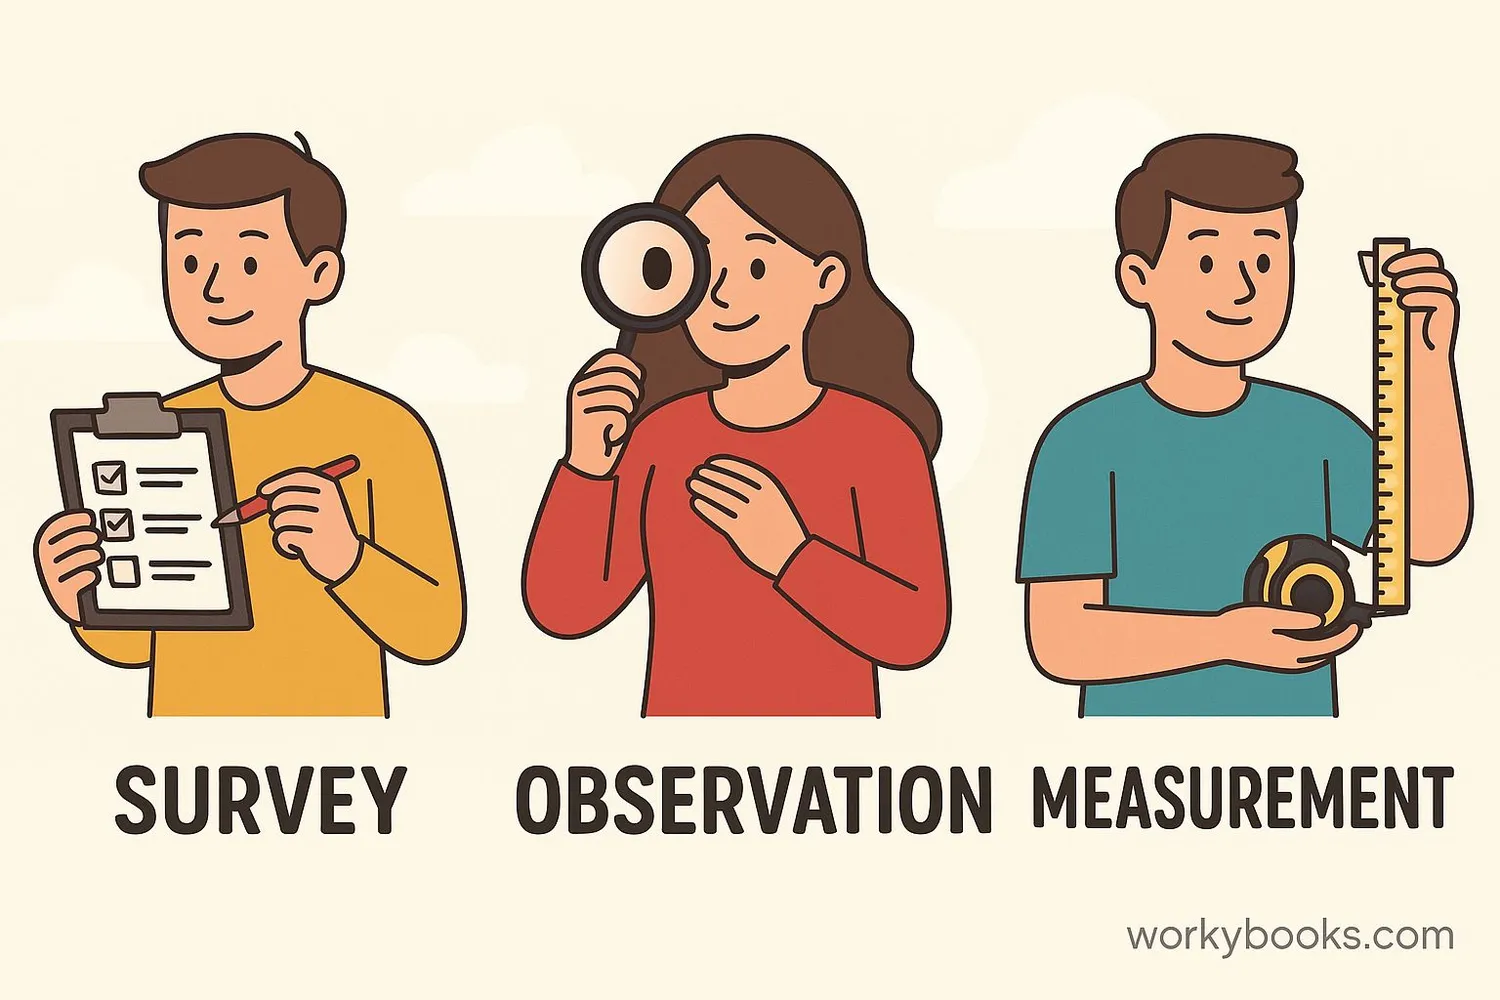
Data collection means gathering information. There are two main types of data:
1. Categorical Data: Groups things by type (like colors, favorite foods)
2. Numerical Data: Uses numbers (like heights, test scores)
We organize data in frequency tables that show how often something occurs:
| Color | Number of Students |
|---|---|
| Red | 8 |
| Blue | 12 |
| Green | 5 |
| Yellow | 3 |
Remember
Good data collection is accurate, organized, and fair. Always count carefully!
Graphs & Charts
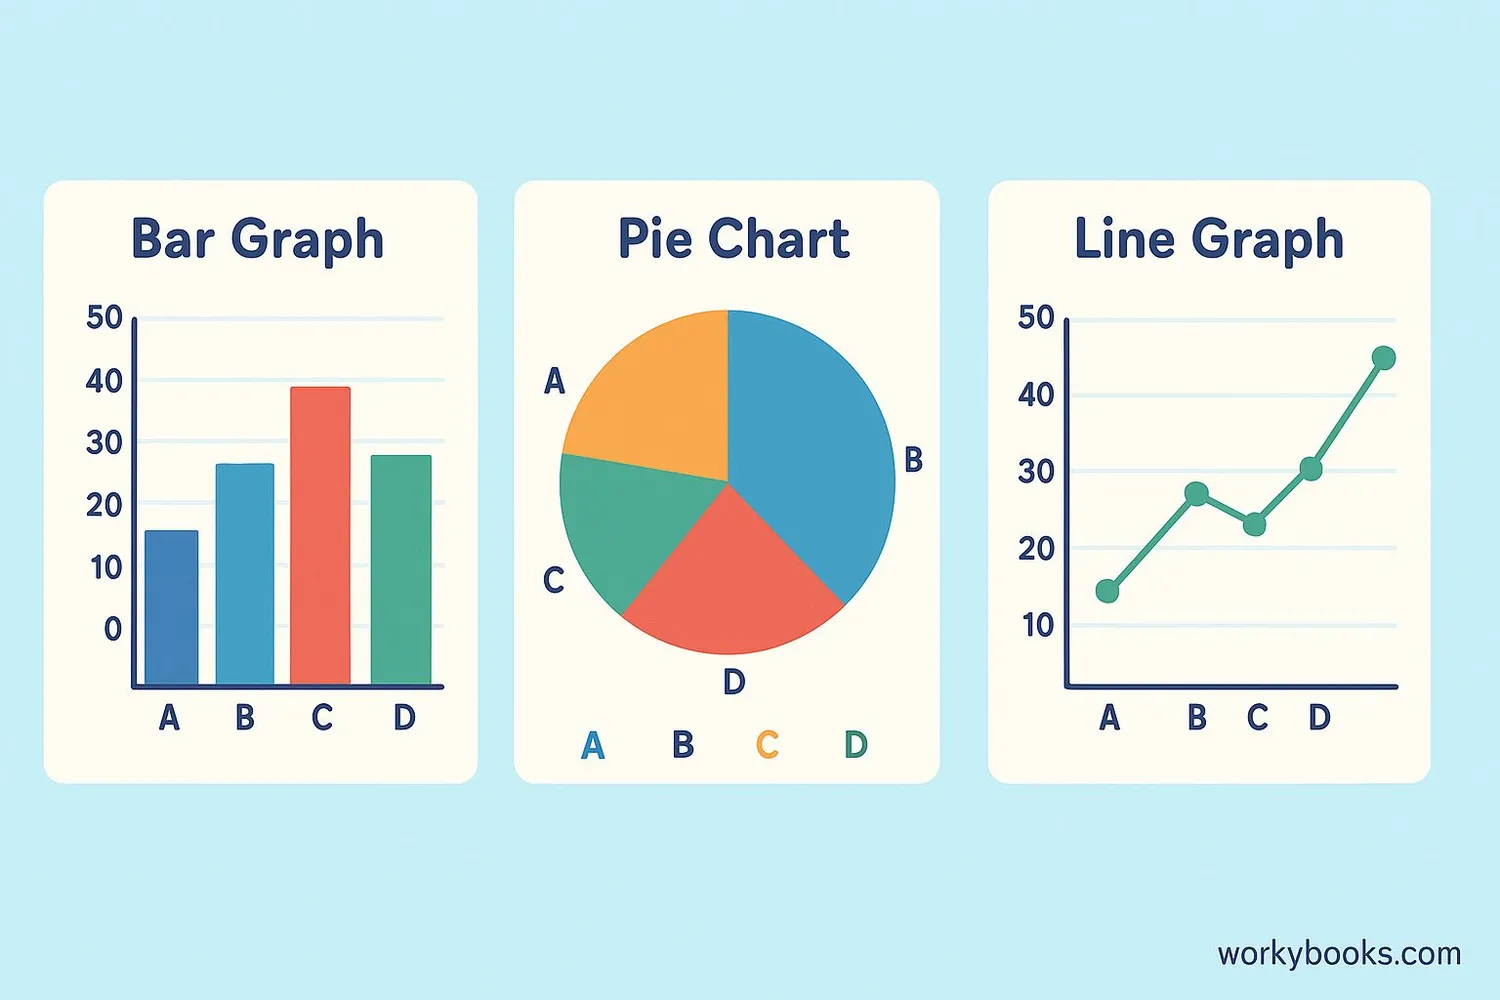
Graphs help us see patterns in data quickly. Here are common types:
Bar Graph: Compares amounts using bars (great for categorical data)
Pie Chart: Shows parts of a whole (good for percentages)
Line Graph: Shows changes over time (like plant growth)
Box and Whisker Plot: Shows how data is spread out (for older students)
Graph Rules
All good graphs need:
- A clear title
- Labeled axes
- Evenly spaced numbers
- Neat, accurate drawing
Averages & Range
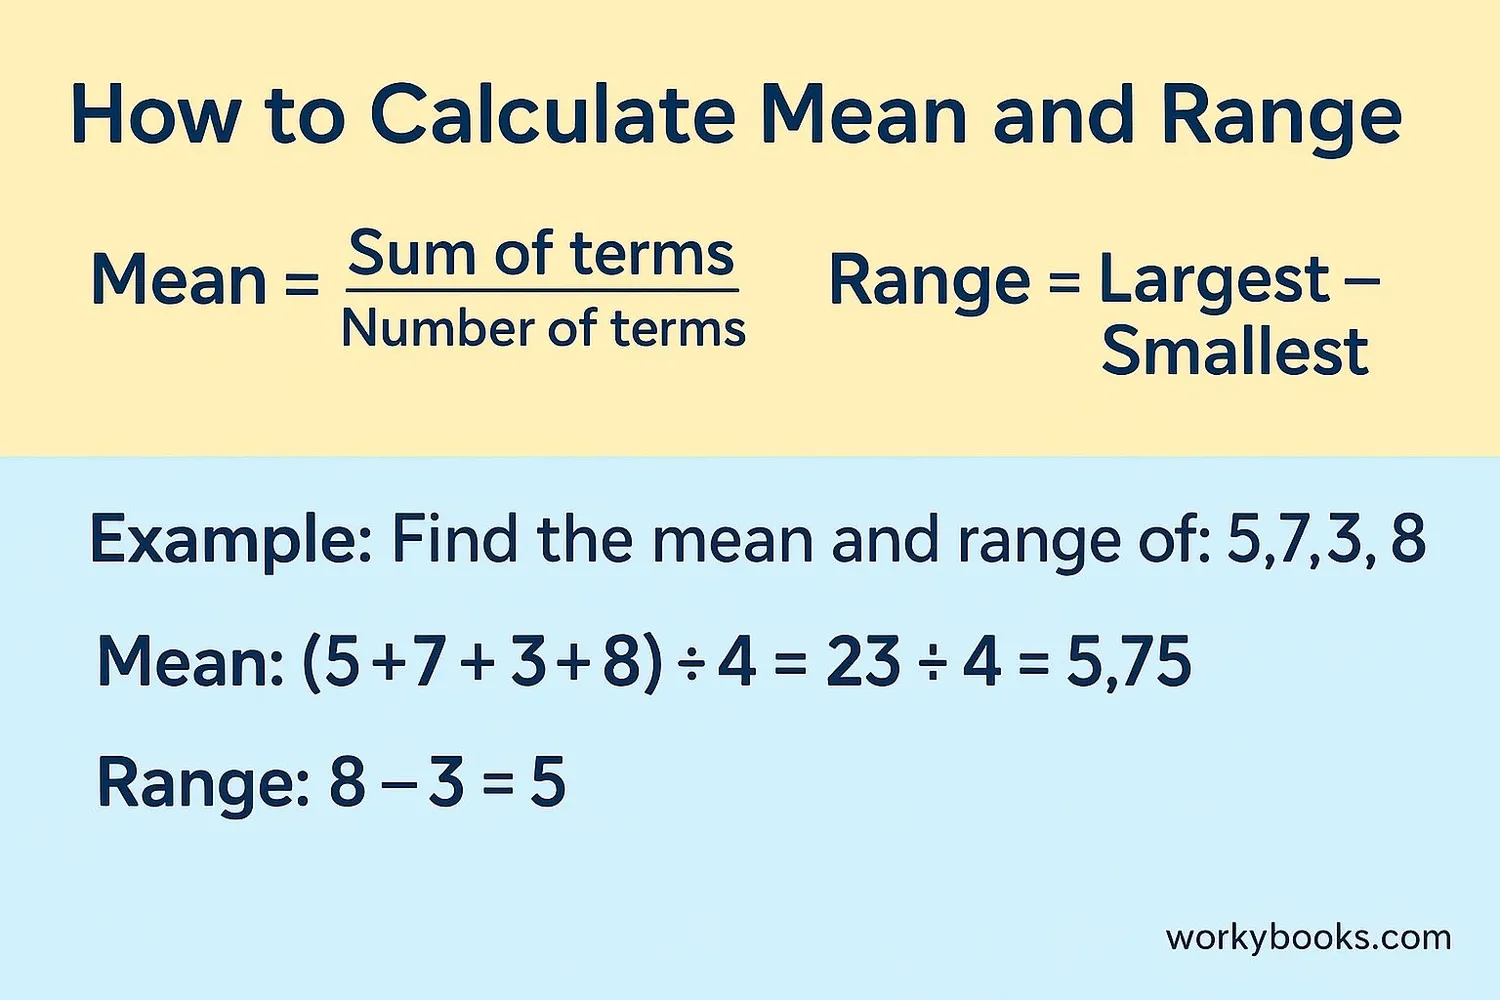
Measures of center help us find typical values:
Mean (Average): Add all numbers, then divide by how many numbers there are
Median: The middle number when data is in order
Mode: The number that appears most often
Range shows how spread out numbers are: Largest - Smallest
Example: Find the mean and range of: 5, 7, 3, 8
Mean: (5+7+3+8) ÷ 4 = 23 ÷ 4 = 5.75
Range: 8 - 3 = 5
Math Tip
The mean can be affected by very high or low numbers. The median often gives a better "typical" value.
Statistics Quiz
Test what you've learned with these 5 questions. Choose the best answer for each.
Frequently Asked Questions
Here are answers to common questions about statistics:
Math Trivia
Discover interesting facts about numbers and statistics:
Ancient Statistics
The earliest known statistical records date back to ancient Babylon (3800 BCE), where they recorded crop yields and trade goods. The Egyptians used statistics to build the pyramids!
Sports Stats
Baseball keeps more statistics than any other sport - over 100 different measurements for each player! The first baseball box score appeared in 1845.
Space Numbers
NASA uses statistics for everything from calculating rocket trajectories to analyzing data from space telescopes. One Mars rover sent back over 200,000 pictures!
Big Data
Every day, humans create about 2.5 quintillion bytes of data! That's 2,500,000,000,000,000,000 zeros and ones. Statistics helps make sense of all this information.
