
T-Tables - Definition, Examples, Quiz, FAQ, Trivia
Learn about Student's t-distribution with simple explanations, examples, and practice activities
What is a T-Table?
A T-Table is a special chart that helps statisticians make decisions about their data. It's used when working with small groups or when we don't know everything about the population we're studying.
Think of it like a cheat sheet that tells us how unusual our results are. If we flip a coin 10 times and get 8 heads, is that normal or special? The t-table helps us decide!
The "T" stands for "Student's t-distribution," which got its name from William Sealy Gosset who wrote under the pen name "Student" when he worked for the Guinness brewery in the early 1900s.
Key Concept
T-tables help us understand if differences between groups are meaningful or just due to chance.
Understanding T-Distribution
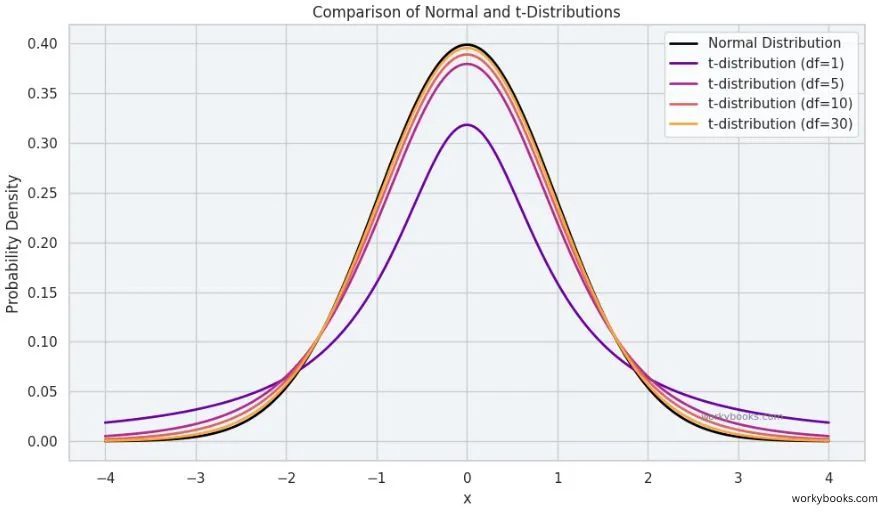
The t-distribution is a special pattern that data follows when we have small sample sizes. It looks similar to the famous "bell curve" (normal distribution) but with some important differences:
1. Tails: The t-distribution has thicker tails than the normal curve. This means extreme values are more common.
2. Sample size: As our sample gets larger, the t-distribution becomes more like the normal distribution.
3. Degrees of freedom: The shape changes based on how much data we have.
Why does this matter? When we have small groups, we can't use the normal distribution rules. The t-distribution gives us more accurate results for small samples.
Remember
The t-distribution is used when sample sizes are small or when the population standard deviation is unknown.
Degrees of Freedom
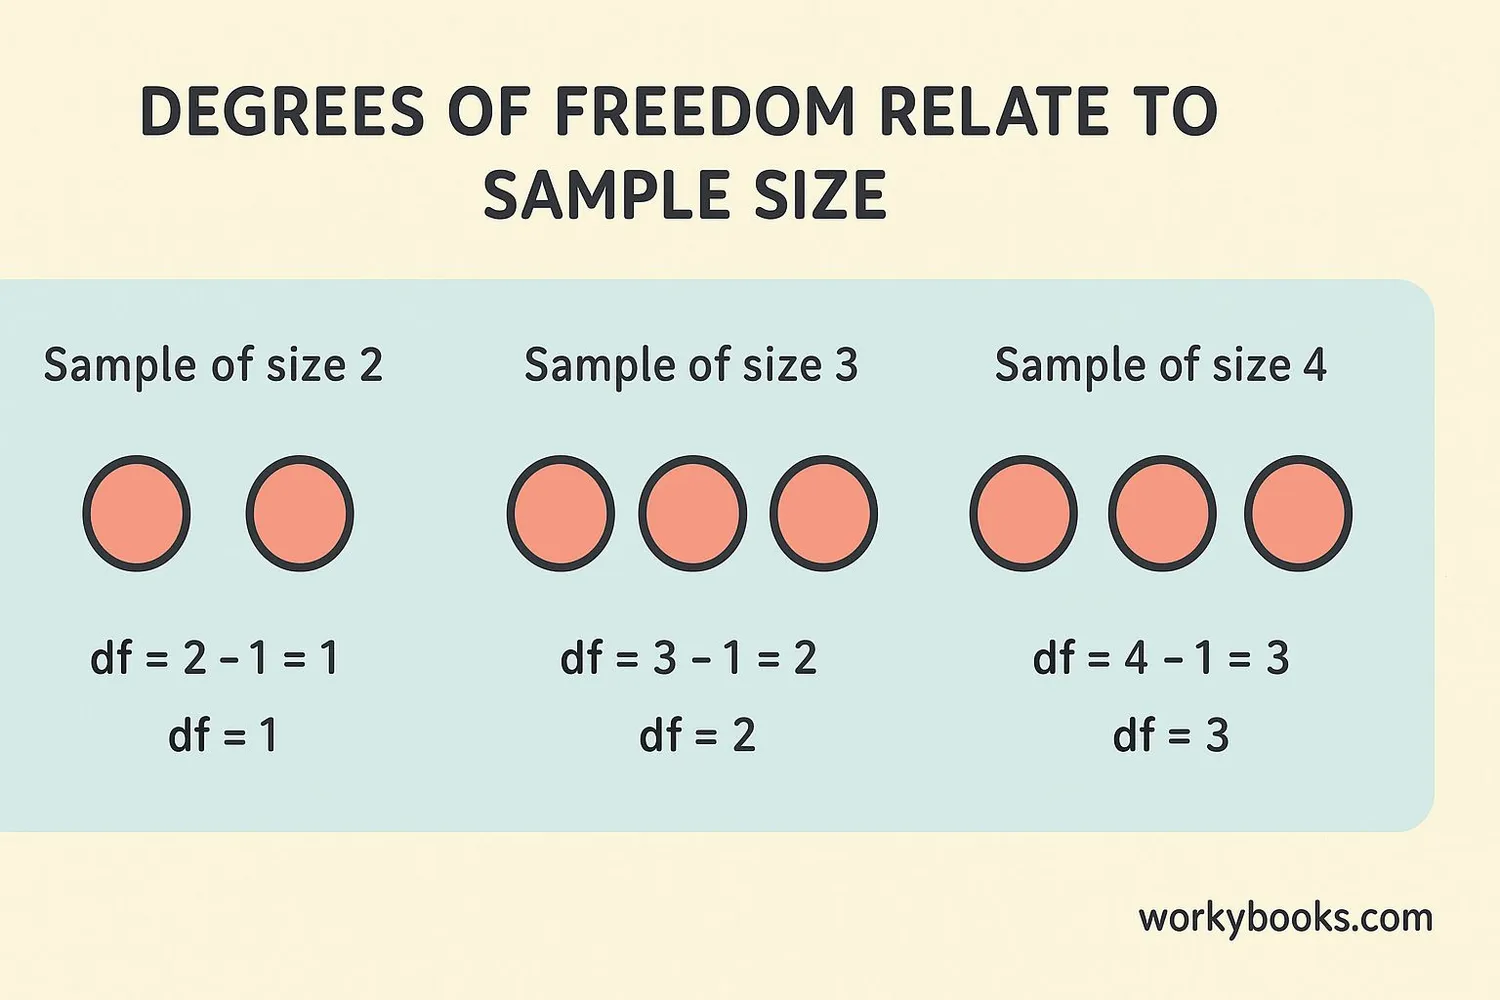
Degrees of freedom (df) might sound complicated, but it's just a way to count how many pieces of information we have that can vary freely. Think of it as how many choices we have before things become fixed.
Simple example: If we know the average of 5 numbers is 10, and we know 4 of the numbers, then the fifth number is determined - it has no freedom to vary. So we have 4 degrees of freedom.
For a t-test, degrees of freedom are usually calculated as:
Degrees of Freedom Formula
Where n is the number of observations in your sample
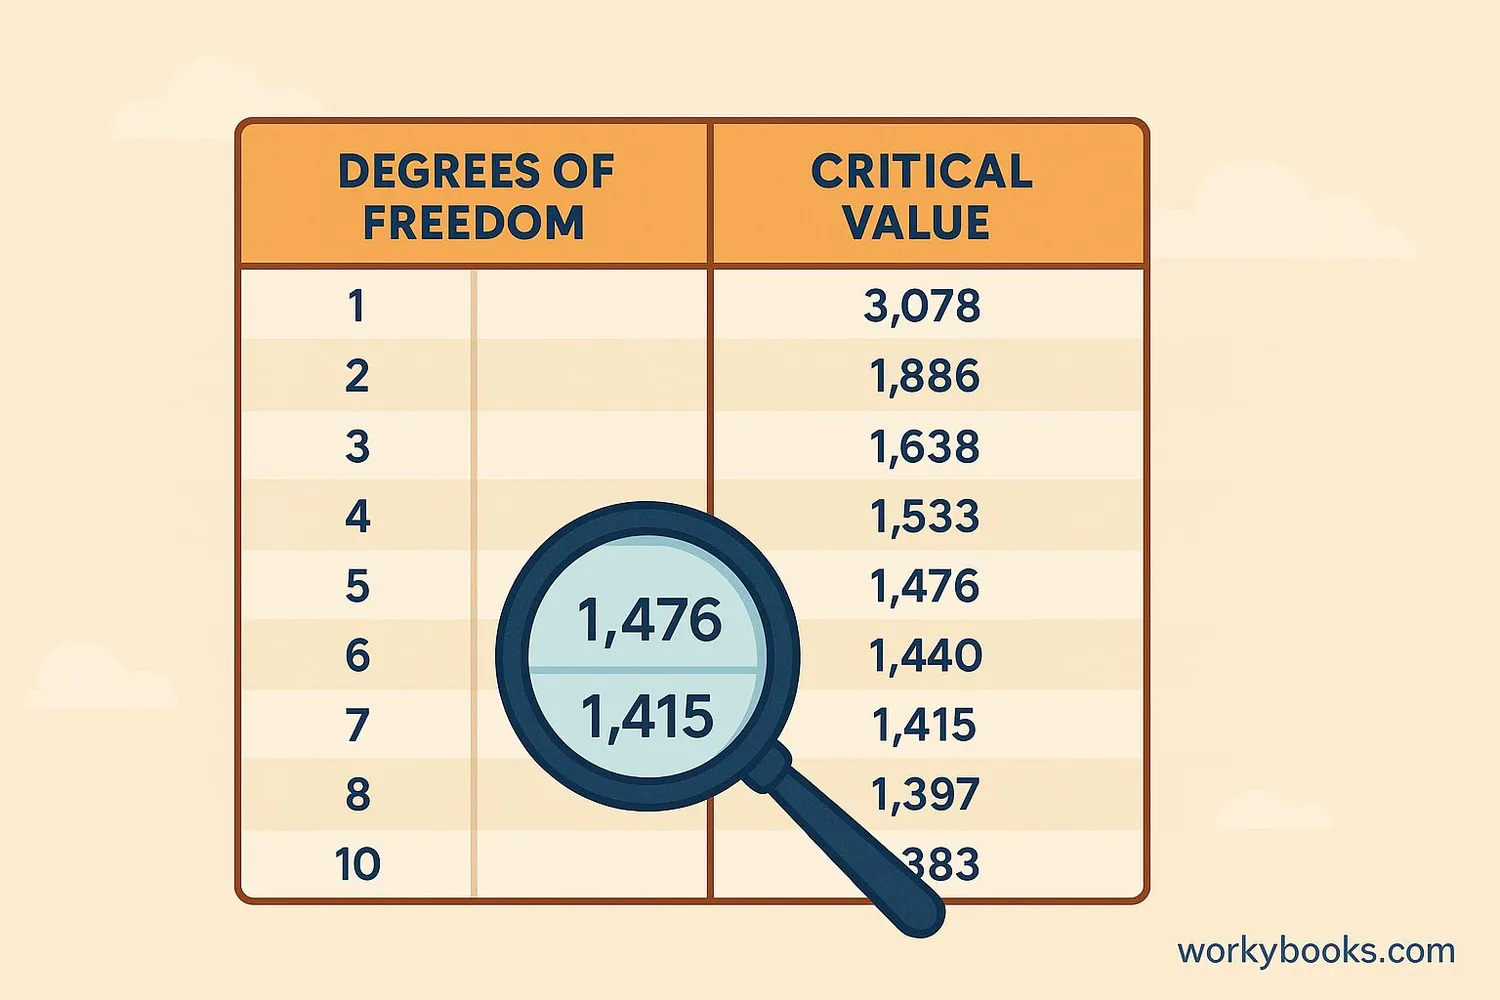
How to Use a T-Table
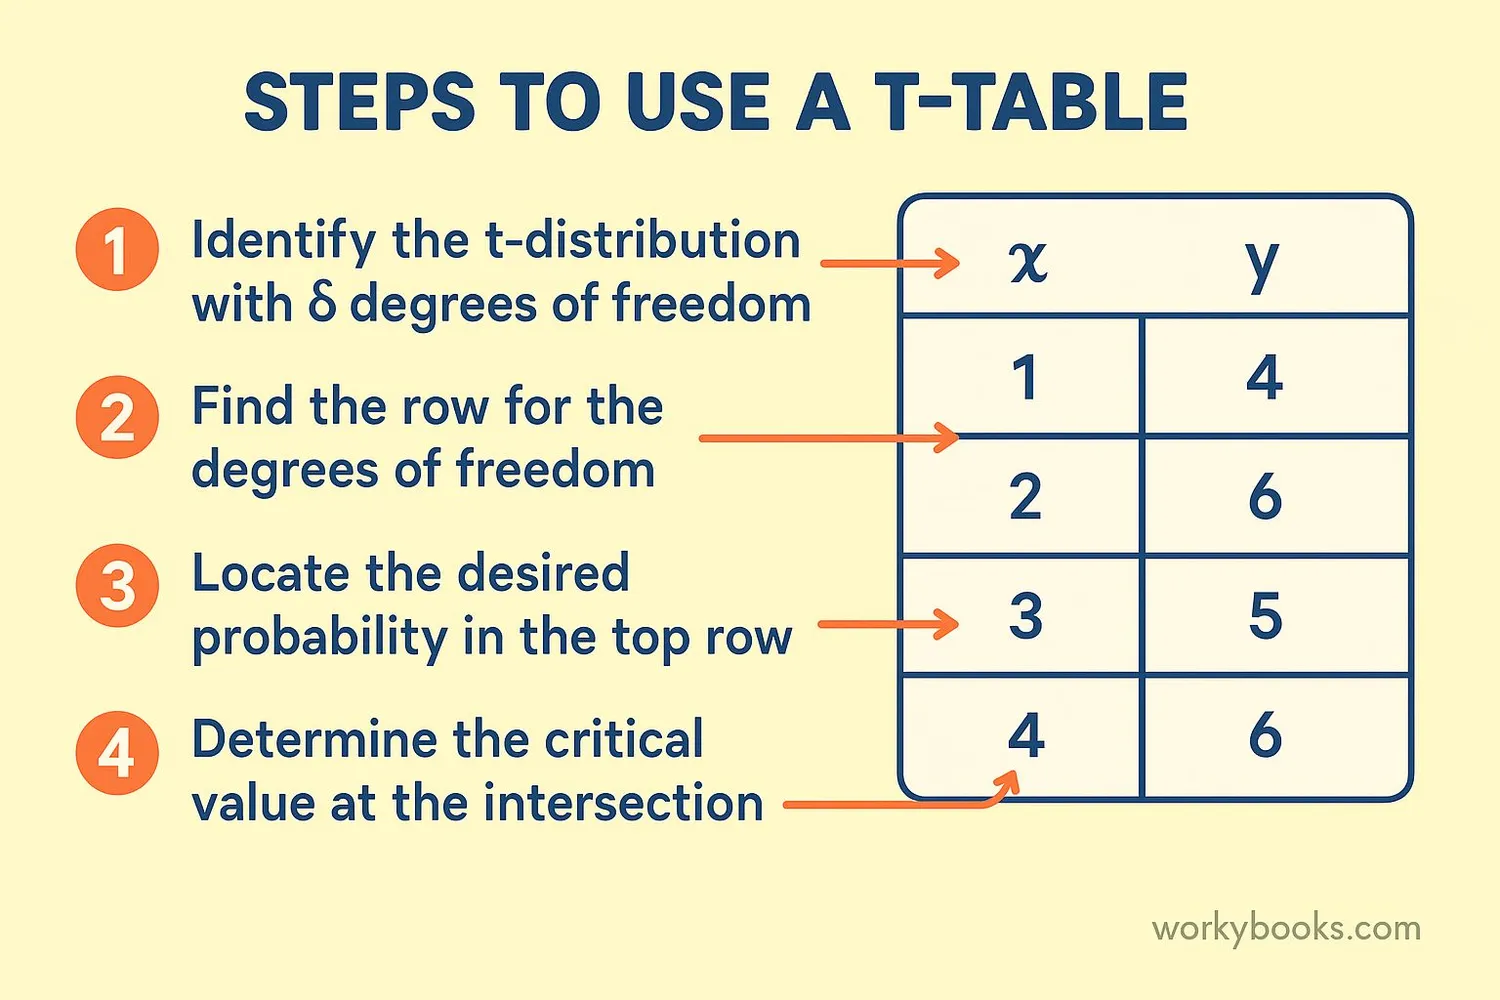
Using a t-table might seem tricky at first, but it's like reading coordinates on a map. Here's how to do it:
Step 1: Determine your degrees of freedom (df = n - 1)
Step 2: Choose your significance level (common ones are 0.10, 0.05, or 0.01)
Step 3: Find the row that matches your degrees of freedom
Step 4: Find the column that matches your significance level
Step 5: The number where the row and column meet is your critical t-value
Let's practice with a simple t-table:
| df | α=0.10 | α=0.05 | α=0.01 |
|---|---|---|---|
| 1 | 6.314 | 12.706 | 63.657 |
| 2 | 2.920 | 4.303 | 9.925 |
| 3 | 2.353 | 3.182 | 5.841 |
| 4 | 2.132 | 2.776 | 4.604 |
| 5 | 2.015 | 2.571 | 4.032 |
| 10 | 1.812 | 2.228 | 3.169 |
| 20 | 1.725 | 2.086 | 2.845 |
| 30 | 1.697 | 2.042 | 2.750 |
Example: If we have 6 measurements (df = 5) and we're using a significance level of 0.10, our critical value is 2.015 (highlighted in orange).
This means that if our calculated t-value is greater than 2.015, we consider our result statistically significant at the 10% level.
Practical Tip
As degrees of freedom increase, the critical values get closer to those of the normal distribution (1.645 for α=0.10, 1.96 for α=0.05).
T-Table Practice Quiz
Test your understanding of t-tables with this 5-question quiz. Choose the correct answer for each question.
Frequently Asked Questions
Here are answers to common questions about t-tables and t-tests:
Statistics Trivia
Discover interesting facts about statistics and t-tests:
The Guinness Connection
The t-test was developed by William Sealy Gosset while working at the Guinness brewery in Dublin. He published under the name "Student" because Guinness didn't allow employees to publish research.
Small Sample Champion
The t-distribution is especially useful for small sample sizes. When Gosset developed it, he was working with sample sizes as small as 3 or 4 measurements!
Space Applications
T-tests were used by NASA engineers during the Apollo missions to analyze small samples of materials and ensure spacecraft safety with limited data.
Most Used Test
The t-test is one of the most commonly used statistical tests in scientific research, featured in thousands of research papers every year across all fields of science.
