
Acceleration - Definition, Examples, Quiz, FAQ, Trivia
Discover how objects change their speed and direction!
What is Acceleration?
Acceleration is how quickly an object changes its speed or direction. It's not just about going faster - it's about any change in velocity! Remember these key points:
Positive acceleration means speeding up
Negative acceleration (deceleration) means slowing down
Changing direction at constant speed is also acceleration
Acceleration happens all around us. When a car starts moving, when a ball is thrown, when you stop running - these are all examples of acceleration!
Physics Fact!
Acceleration is measured in meters per second squared (m/s²). This means every second, your speed changes by that many meters per second!
Acceleration Formula
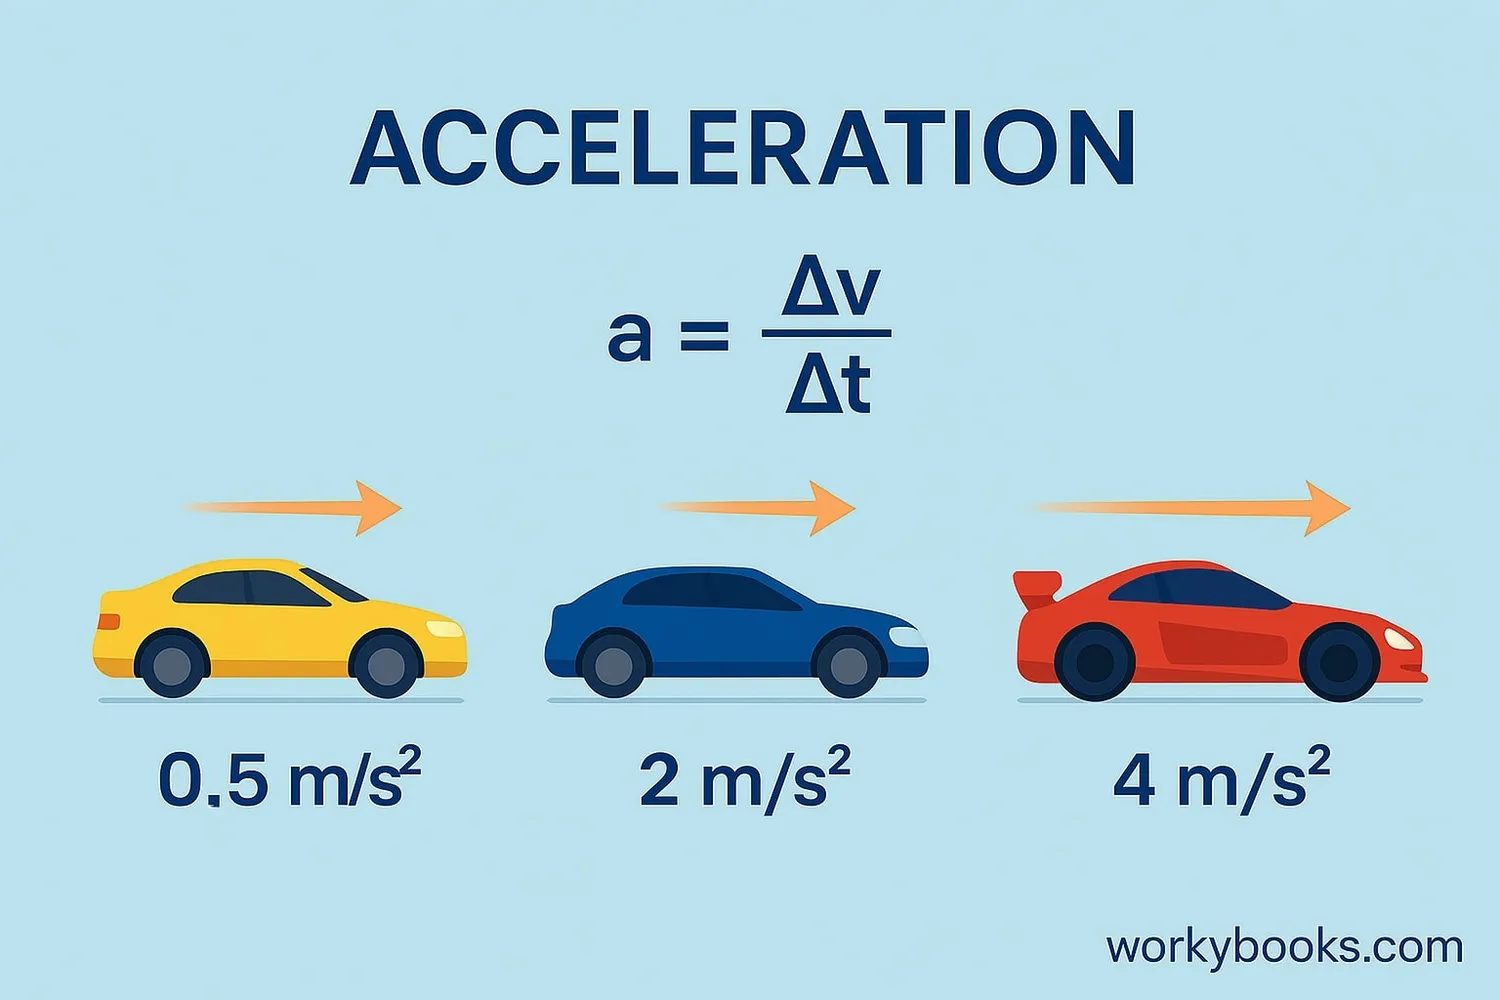
We calculate acceleration using this simple formula:
Or in math terms: a = (vf - vi) / t
Let's break it down:
• Final Velocity (vf): Speed at the end
• Initial Velocity (vi): Speed at the start
• Time (t): How long the change took
Example: If a car goes from 0 to 60 km/h in 6 seconds, its acceleration is (60-0)/6 = 10 km/h per second.
Identify Velocities
Find the starting and ending speeds
Calculate Difference
Subtract initial from final velocity
Divide by Time
Divide the difference by the time taken
Formula Tip!
Remember to use consistent units! If velocity is in m/s and time in seconds, acceleration will be in m/s².
Acceleration Due to Gravity
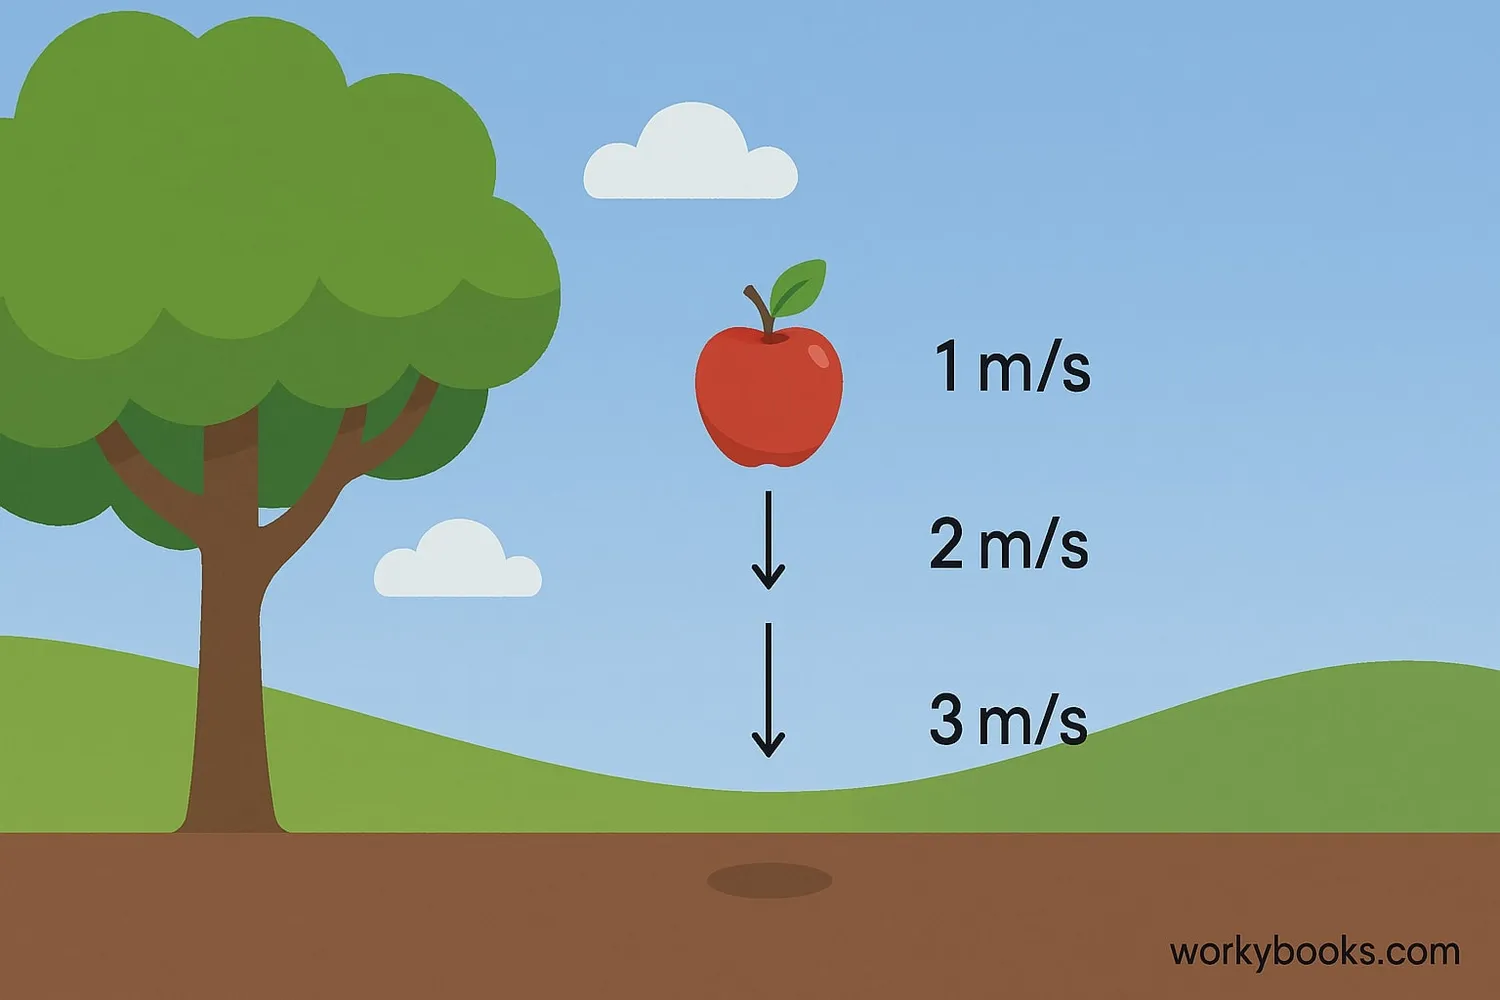
Gravity causes all objects to accelerate toward Earth at the same rate! On Earth, this acceleration is approximately:
This means every second, a falling object's speed increases by 9.8 m/s. Interesting facts about gravity acceleration:
• It's the same for all objects regardless of mass
• In a vacuum, a feather falls as fast as a hammer
• On the Moon, gravity acceleration is only 1.6 m/s²
• Jupiter's gravity acceleration is 24.8 m/s²
This constant acceleration is why falling objects keep speeding up until they hit the ground!
Space Fact!
Astronauts on the Moon dropped a hammer and feather at the same time. With no air resistance, they hit the Moon's surface simultaneously!
Velocity and Time
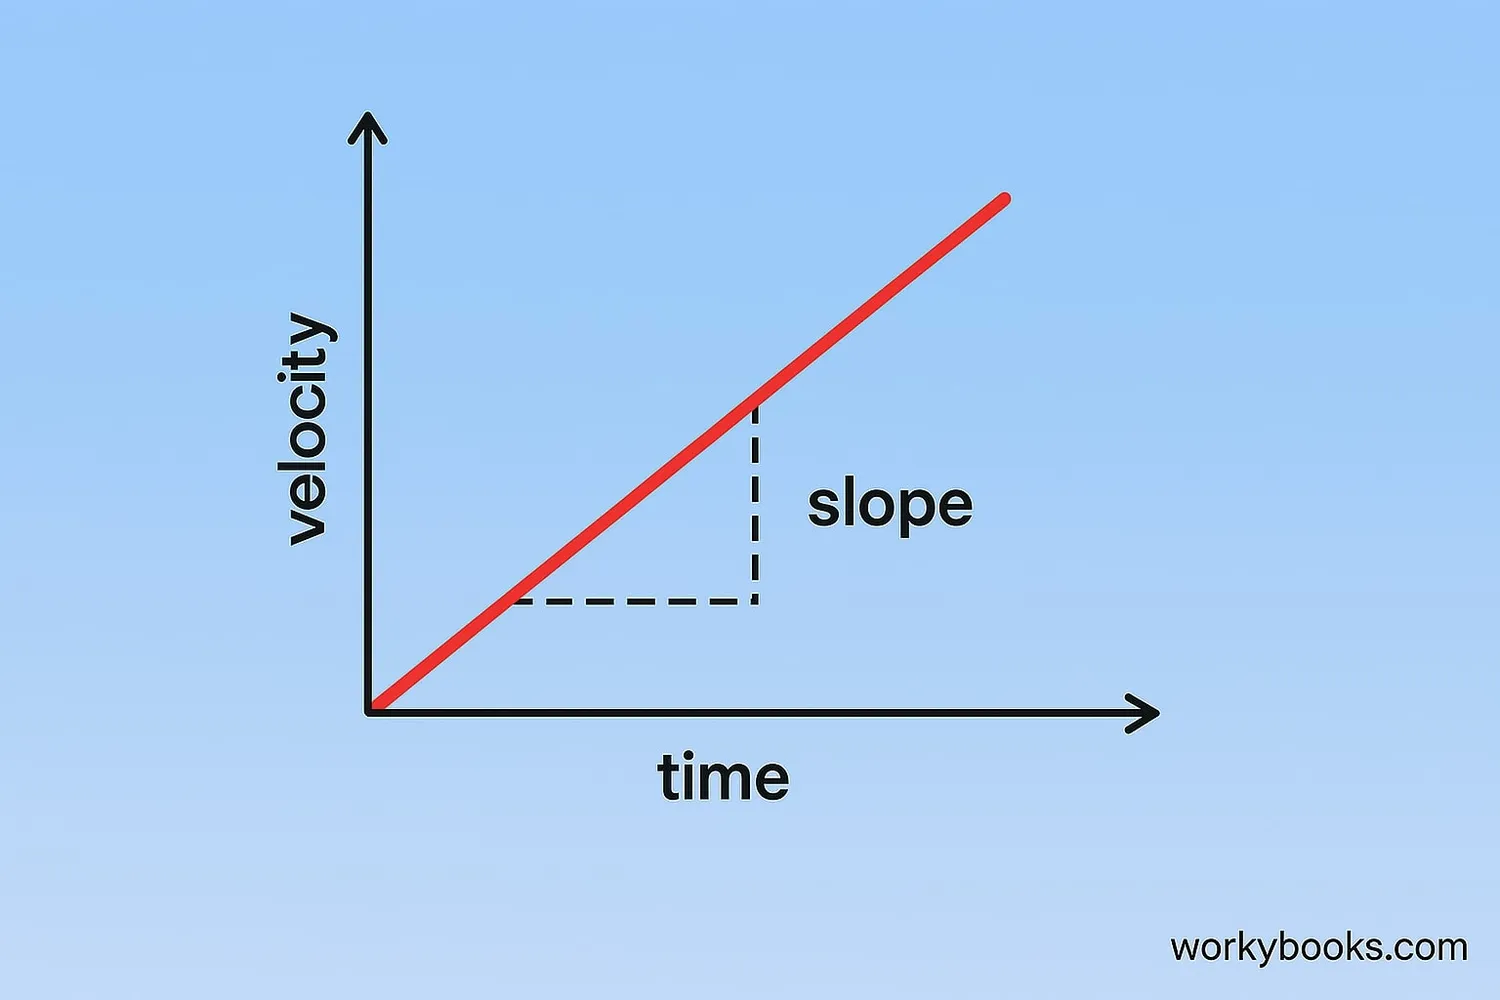
Acceleration describes how velocity changes over time. This relationship can be shown on a velocity-time graph:
Steeper Slope
Greater acceleration
Horizontal Line
Constant velocity (no acceleration)
Downward Slope
Deceleration (negative acceleration)
Important relationships:
• Acceleration is the slope of a velocity-time graph
• Area under acceleration-time graph gives velocity change
• Constant acceleration creates a straight line on velocity-time graph
Example: If a velocity-time graph has a slope of 5 m/s², the object is accelerating at 5 meters per second every second.
Acceleration Quiz
Test your acceleration knowledge with this physics quiz! Answer all 5 questions to see how much you've learned.
Frequently Asked Questions
Here are answers to common questions about acceleration:
Acceleration Trivia
Discover amazing facts about acceleration in our world and beyond!
Animal Acceleration
The cheetah has the highest land acceleration of any animal, going from 0 to 60 mph in just 3 seconds! That's faster than most sports cars.
Space Launch Acceleration
Astronauts experience up to 3g during rocket launches - that's three times Earth's gravity! This means they feel three times heavier during takeoff.
Tiny Accelerators
Particle accelerators like the Large Hadron Collider accelerate protons to 99.999999% of light speed - that's 11,000 laps around the accelerator per second!
Human Acceleration
Elite sprinters accelerate faster than most production cars. Usain Bolt reached 27.8 mph in his world record 100m dash - accelerating from 0 to 20 mph in his first two seconds!
