Bar Graphs
Interactive worksheet with auto-grading, instant feedback, and printable PDF.
By completing this purchase you agree to our Terms of Use and Privacy Policy. Your subscription renews automatically until you cancel. You can cancel anytime from your account settings. All sales are final and non-refundable. Digital content is available for download in your account immediately upon purchase.
What's included
Bar Graphs preview and details
About this worksheet
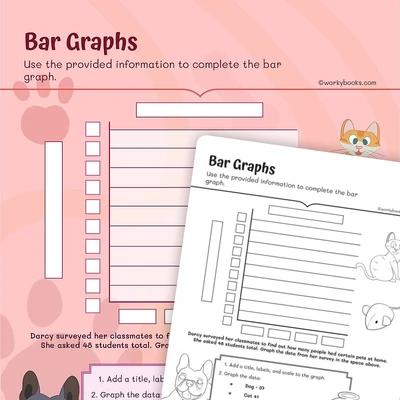
Bar Graphs is an engaging mathematics worksheet designed to help students interpret and analyze data presented in a bar graph format. This interactive and printable worksheet focuses on a specific scenario where students at a school have voted for their favorite pets. The results of this vote are displayed in a colorful and easy-to-read bar graph, featuring various animals such as rabbits, guinea pigs, fish, bearded dragons, and turtles.
The worksheet challenges students with four thought-provoking questions that require careful examination of the graph. These questions assess the students' ability to identify the most and least popular pets, compare vote counts between different animals, and recognize patterns in the data. This interactive and printable worksheet not only reinforces graphing skills but also promotes critical thinking and data interpretation, essential components of mathematical literacy in real-world contexts.
What will your child learn through this worksheet?
- How to read and interpret bar graphs
- Comparing and contrasting data points in a visual format
- Identifying maximum and minimum values in a dataset
- Performing simple calculations based on graph information
Learning Outcomes
Cognitive
- Students will accurately identify the animal with the most and least votes from the bar graph.
- Students will compare data points to find animals with equal vote counts.
- Students will calculate the difference in votes between two specific animals.
Psychomotor
- Students will develop eye-hand coordination while tracing bar heights to determine vote counts.
- Students will practice writing skills by recording their answers clearly and concisely.
Affective
- Students will gain confidence in their ability to interpret visual data representations.
- Students will develop an appreciation for how graphs can efficiently communicate information.
Interpersonal/Social
- Students will learn to discuss their findings and reasoning with peers, promoting collaborative learning.
- Students will develop skills in explaining their interpretations of the graph to others.
Tags
bar graphs, data interpretation, mathematics, favorite pets, vote counting, comparing data, elementary math, visual learning
Common Core standards covered
Draw a scaled picture graph and a scaled bar graph to represent a data set with several categories. Solve one- and two-step "how many more" and "how many less" problems using information presented in scaled bar graphs. For example, draw a bar graph in which each square in the bar graph might represent 5 pets.
Perfect for the way you teach
- Assign in one click
- Track progress per student
- Auto-graded results
- Practice at home
- Print or do on-screen
- Build skill mastery
- Standards-aligned
- Self-paced
- Ready-to-use today