Bar Graphs: Sports
Interactive worksheet with auto-grading, instant feedback, and printable PDF.
By completing this purchase you agree to our Terms of Use and Privacy Policy. Your subscription renews automatically until you cancel. You can cancel anytime from your account settings. All sales are final and non-refundable. Digital content is available for download in your account immediately upon purchase.
What's included
Bar Graphs: Sports preview and details
About this worksheet
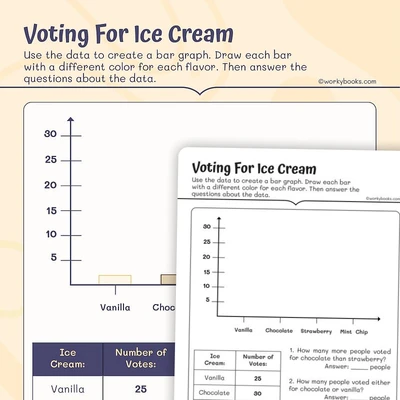
Bar Graphs: Sports is an interactive and printable worksheet designed to help students understand and interpret data presented in a bar graph format. This worksheet presents a bar graph showing the results of a second-grade class vote on their favorite sports. The worksheet includes questions that require students to analyze the data and draw conclusions based on the information presented in the bar graph.
This interactive and printable worksheet is an excellent resource for reinforcing students' understanding of data representation and analysis using bar graphs. The clear and concise format of the worksheet makes it easy for students to grasp the concepts and practice their skills in interpreting and analyzing data from bar graphs.
What will your child learn through this worksheet?
- Interpreting data presented in a bar graph format
- Analyzing and comparing data points
- Drawing conclusions from data
Learning Outcomes
Cognitive
- Understand the concept of data representation using bar graphs
- Develop the ability to read and interpret data from bar graphs
- Analyze and compare data points to identify patterns and trends
Psychomotor
- Practice reading and interpreting visual representations of data
- Develop the ability to accurately interpret and analyze numerical data
Affective
- Cultivate an interest in data analysis and interpretation
- Build confidence in working with data and visual representations
Interpersonal/Social
- Collaborate with peers to discuss and analyze data
- Develop the ability to communicate findings and conclusions effectively
Tags:
Bar Graphs, Data Analysis, Data Interpretation, Sports, Classroom Activity, Cognitive, Psychomotor, Affective, Interpersonal/Social
Common Core standards covered
Draw a picture graph and a bar graph (with single-unit scale) to represent a data set with up to four categories. Solve simple put-together, take-apart, and compare problems1 using information presented in a bar graph.
Perfect for the way you teach
- Assign in one click
- Track progress per student
- Auto-graded results
- Practice at home
- Print or do on-screen
- Build skill mastery
- Standards-aligned
- Self-paced
- Ready-to-use today