Warming Trend Detectives
Interactive worksheet with auto-grading, instant feedback, and printable PDF.
- Format
- Interactive (Online), Printable (PDF)
- Grades
- 345
- Subjects
- sciencemath
- Standards
- NGSS 3-ESS2-1; CCSS 3.MD.B.3
What's included
About this worksheet
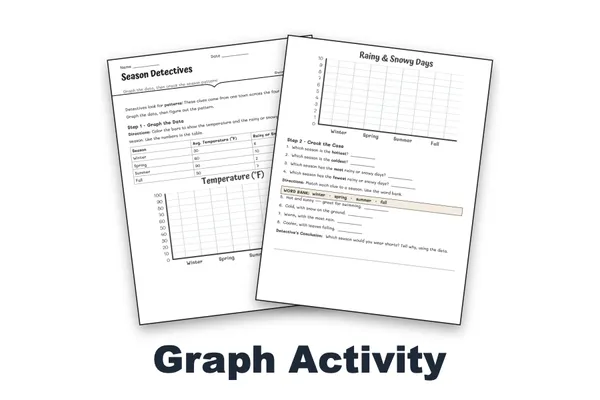
Warming Trend Detectives introduces your third graders to reading change over time. Students graph one place's average temperature across several decades, then spot the trend in their own bar graph.
In Step 1, students use a data table to color a bar graph of the average temperature for 1990, 2000, 2010, and 2020. In Step 2, they identify the warmest and coolest years, use a word bank to describe how the temperature is changing, work out how many degrees warmer one year was than another, and finish with a “Detective's Prediction” about the future—explaining their thinking using the pattern.
This no-prep printable supports NGSS 3-ESS2-1 (representing temperature data) and builds scaled bar graph skills from CCSS Math 3.MD.B.3, with a gentle, data-based introduction to how climates can change over time.
What's included:
- A two-page, no-prep worksheet with a data table and bar graph
- Trend questions, a word bank, and a prediction prompt
- A complete answer key with the graph filled in
Great for science centers, math centers, or an Earth-science unit. Just print and investigate!
Perfect for the way you teach
- Assign in one click
- Track progress per student
- Auto-graded results
- Practice at home
- Print or do on-screen
- Build skill mastery
- Standards-aligned
- Self-paced
- Ready-to-use today