WorksheetPremium

Daylight Through the Year

Interactive worksheet with auto-grading, instant feedback, and printable PDF.

No ratings yet
Grade 6ScienceInteractive · Printable
Aligned toTX.SCI.6.9ANGSS MS-ESS1-1CCSS.RST.6-8.7
Just this resource
$1.50
One-time purchase
Best value
Unlock everything
$49.99$29.99/yr
40% off until Oct 31 — 10,000+ resources
Renews at $49.99/year.

By completing this purchase you agree to our Terms of Use and Privacy Policy. Your subscription renews automatically until you cancel. You can cancel anytime from your account settings. All sales are final and non-refundable. Digital content is available for download in your account immediately upon purchase.

Unlock above to use these actions

What's included

2 worksheet pages
Auto-graded
3 Common Core standards
Assign to a class
Classroom-ready
Printable PDF

Daylight Through the Year preview and details

About this worksheet

Connect the seasons to real data with this one-page graph worksheet! Students read a bar graph of daylight hours in Austin, Texas, and explain the pattern using Earth's tilt.

The passage explains that as Earth revolves around the Sun, the number of hours of daylight changes. In the Northern Hemisphere, the longest day is around June 21, when the North Pole tilts most toward the Sun, and the shortest day is around December 21, when it tilts most away. In March and September, day and night are almost equal. Students also learn that more daylight gives the ground and air more time to warm up, which is one reason summer is hot. A wide, black and white bar graph at the top of the page shows the hours of daylight in Austin in the middle of each month, from about 10 hours in December to about 14 hours in June. In the first activity, students use the graph to circle the month with the most daylight, the month with the least, and the hours of daylight in March. In the second activity, students decide if three sentences about the graph are true or false. The sheet is written to Texas TEKS 6.9A and also fits NGSS MS-ESS1-1.

What's inside:

  • A short passage with a daylight bar graph for Austin, Texas
  • 3 graph reading questions
  • 3 true or false sentences
  • A visual answer key

How teachers use it:

  • To add data and graph reading to a seasons unit
  • For bell work, stations, or an exit ticket
  • As homework or sub plans, with no prep needed

It takes about 10 minutes and prints clearly in black and white. This worksheet is part of our Reading in Science series on the Sun, Earth, and Moon.

Published by Workybooks
Who it's for

Perfect for the way you teach

Teachers
  • Assign in one click
  • Track progress per student
  • Auto-graded results
Parents
  • Practice at home
  • Print or do on-screen
  • Build skill mastery
Homeschoolers
  • Standards-aligned
  • Self-paced
  • Ready-to-use today
Topics

Reviews & Ratings

No reviews yet. Be the first to share your experience!

Related worksheets

19 more
Worksheet
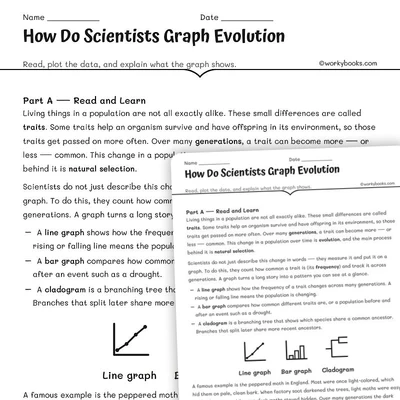
How Do Scientists Graph Evolution worksheet for grades 5 to 8
Grades 5–8

How Do Scientists Graph Evolution

science · NGSS MS-LS4-6+1

$1.50
Worksheet
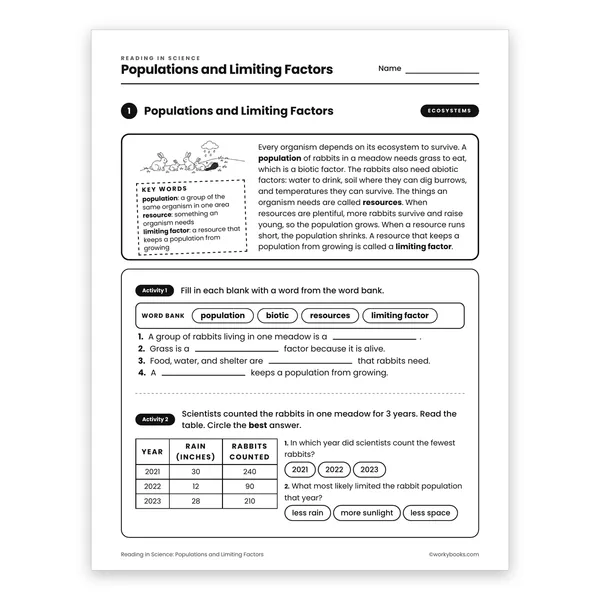
Populations and Limiting Factors worksheet for grade 6
Grade 6

Populations and Limiting Factors

life science · TX.SCI.6.12A+3

$1.50
Worksheet
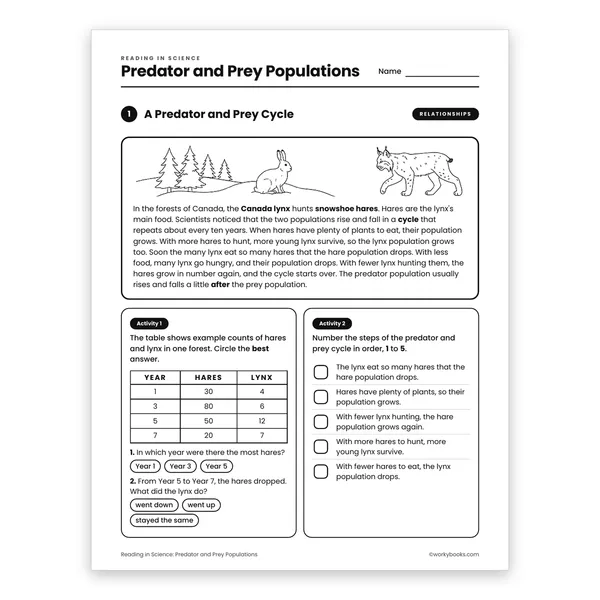
Predator and Prey Populations worksheet for grade 6
Grade 6

Predator and Prey Populations

life science · TX.SCI.6.12B+3

$1.50
Worksheet
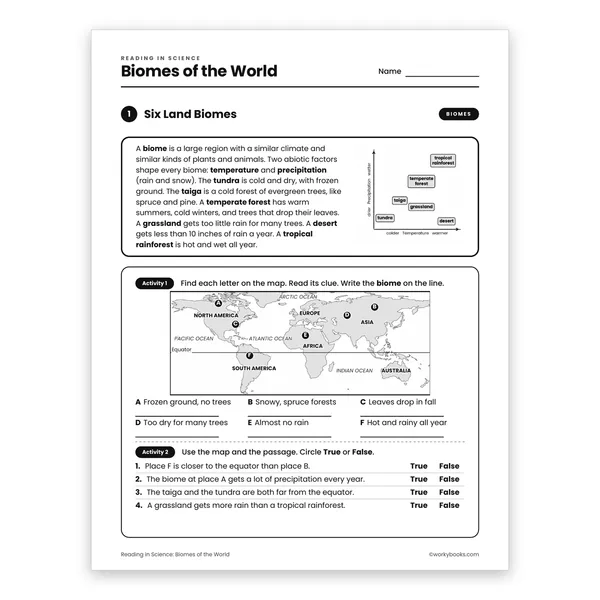
Biomes of the World worksheet for grade 7
Grade 7

Biomes of the World

life science · TX.SCI.7.12B+2

$1.50
Worksheet
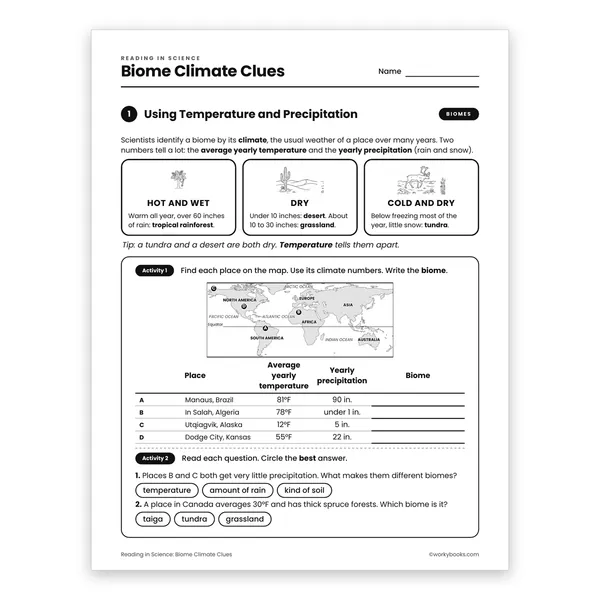
Biome Climate Clues worksheet for grade 7
Grade 7

Biome Climate Clues

life science · TX.SCI.7.12B+2

$1.50
Worksheet
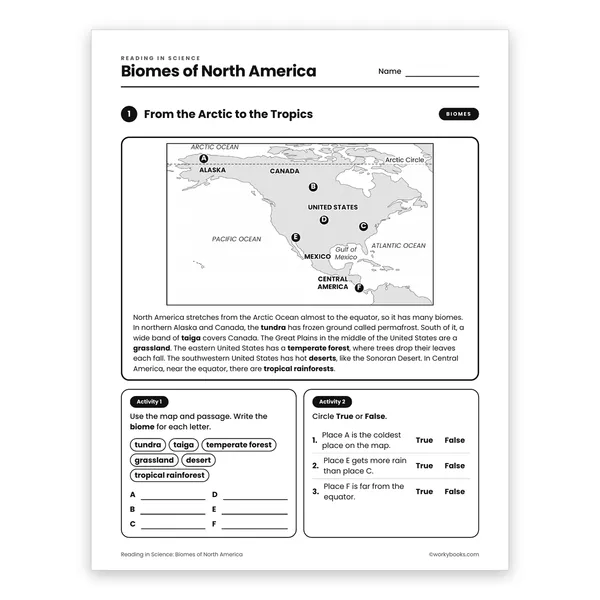
Biomes of North America worksheet for grade 7
Grade 7

Biomes of North America

life science · TX.SCI.7.12B+2

$1.50
Worksheet
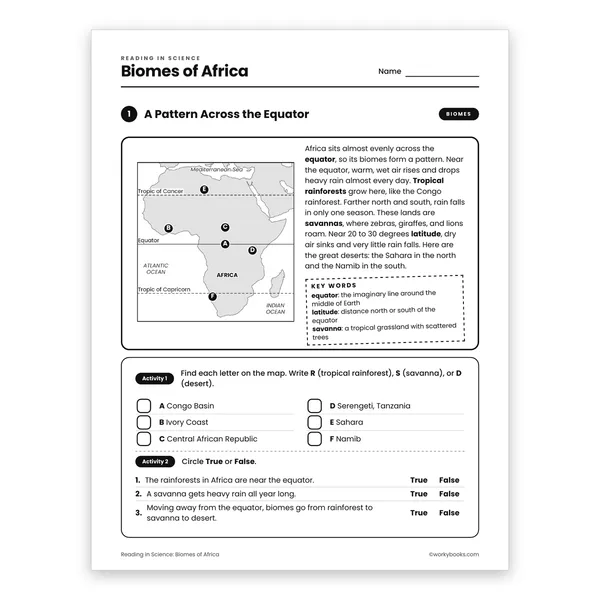
Biomes of Africa worksheet for grade 7
Grade 7

Biomes of Africa

life science · TX.SCI.7.12B+2

$1.50
Worksheet
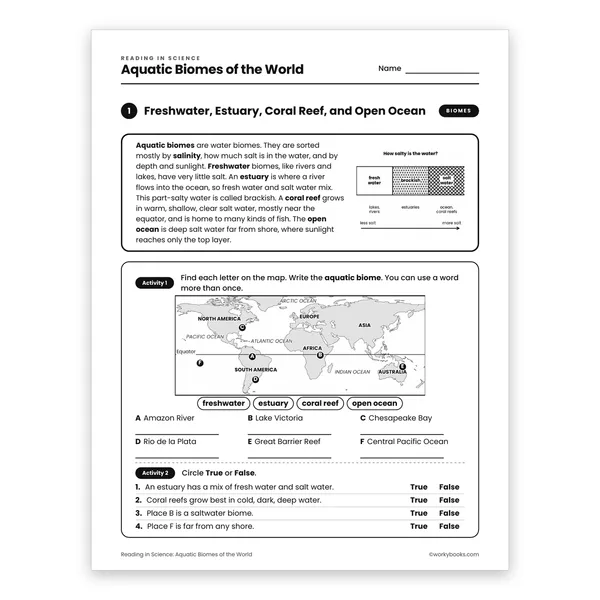
Aquatic Biomes of the World worksheet for grade 7
Grade 7

Aquatic Biomes of the World

life science · TX.SCI.7.12B+2

$1.50
Worksheet
Ocean Zones worksheet for grade 7
Grade 7

Ocean Zones

life science · TX.SCI.7.12B+2

$1.50
Worksheet
Layers of Earth worksheet for grade 6
Grade 6

Layers of Earth

earth and space science · TX.SCI.6.10B+2

$1.50
Worksheet
Inside the Earth worksheet for grade 6
Grade 6

Inside the Earth

earth and space science · TX.SCI.6.10B+2

$1.50
Worksheet
The Rock Cycle worksheet for grade 6
Grade 6

The Rock Cycle

earth and space science · TX.SCI.6.10C+3

$1.50
Worksheet
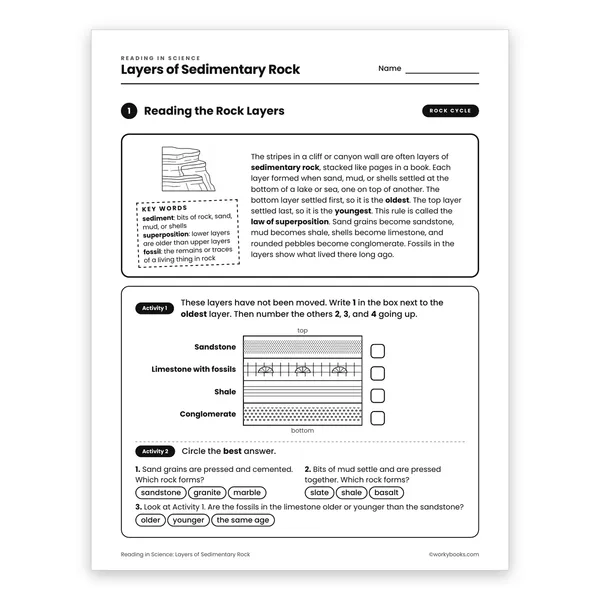
Layers of Sedimentary Rock worksheet for grade 6
Grade 6

Layers of Sedimentary Rock

earth and space science · TX.SCI.6.10C+3

$1.50
Worksheet
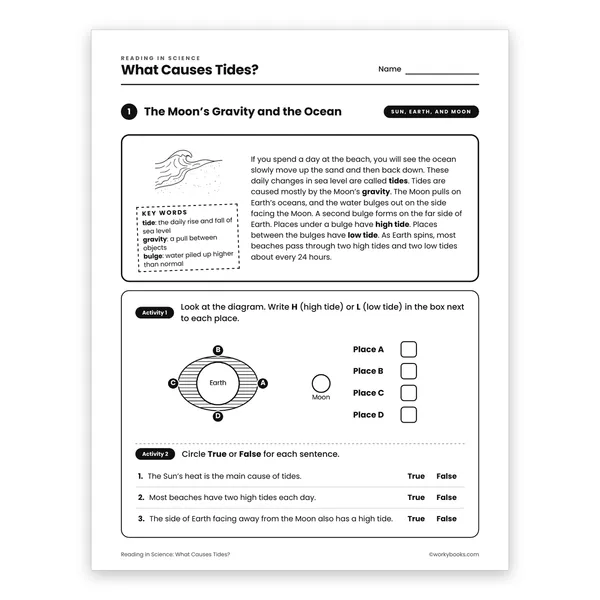
What Causes Tides? worksheet for grade 6
Grade 6

What Causes Tides?

earth and space science · TX.SCI.6.9B+2

$1.50
Worksheet
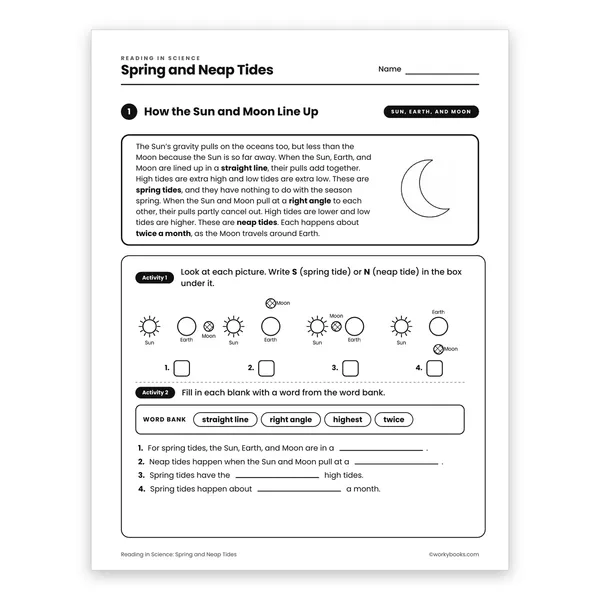
Spring and Neap Tides worksheet for grade 6
Grade 6

Spring and Neap Tides

earth and space science · TX.SCI.6.9B+3

$1.50
Worksheet
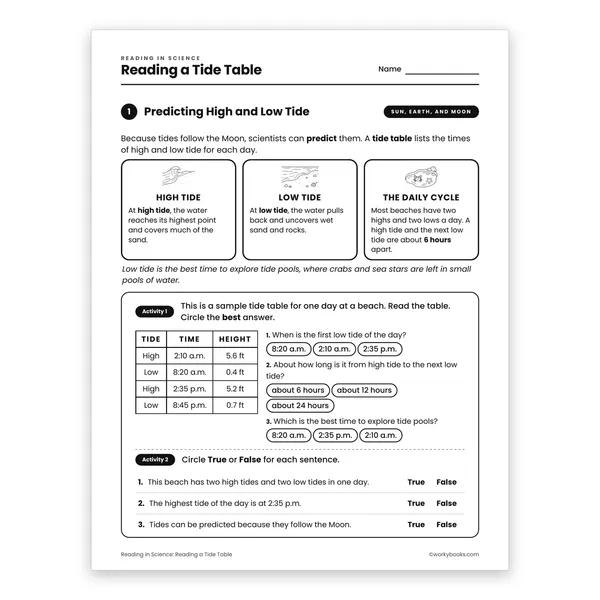
Reading a Tide Table worksheet for grade 6
Grade 6

Reading a Tide Table

earth and space science · TX.SCI.6.9B+2

$1.50
Worksheet
Control and Experimental Groups worksheet for grade 6
Grade 6

Control and Experimental Groups

science practices · TX.SCI.6.1B+2

$1.50
Worksheet
Graphs and Patterns worksheet for grade 6
Grade 6

Graphs and Patterns

science practices · TX.SCI.6.1F+1

$1.50
Worksheet
Solar Eclipses worksheet for grades 6 to 8
Grades 6–8

Solar Eclipses

science → earth and space science → earth and solar system · NGSS MS-ESS1-1

$1.50
Copyright © 2026 Workybooks Classroom. Made with ♥ in California.