Desert Animals Bar Graph
Interactive worksheet with auto-grading, instant feedback, and printable PDF.
By completing this purchase you agree to our Terms of Use and Privacy Policy. Your subscription renews automatically until you cancel. You can cancel anytime from your account settings. All sales are final and non-refundable. Digital content is available for download in your account immediately upon purchase.
What's included
Desert Animals Bar Graph preview and details
About this worksheet
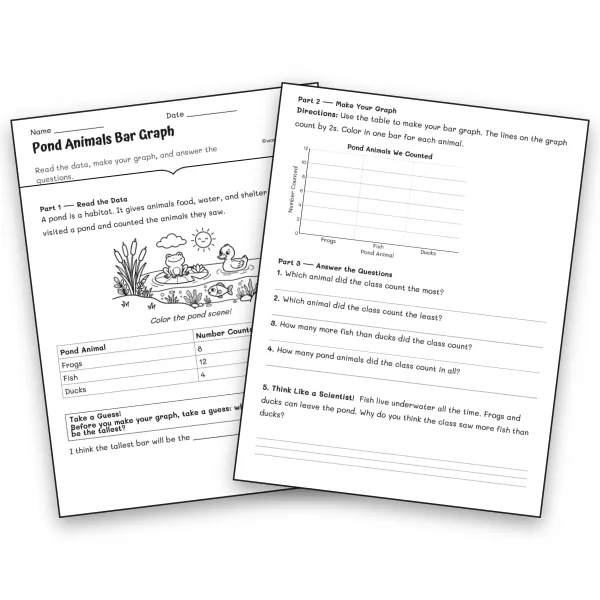
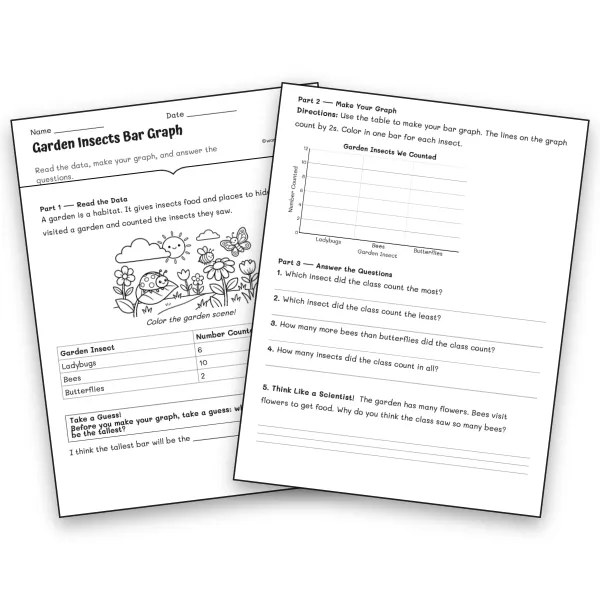
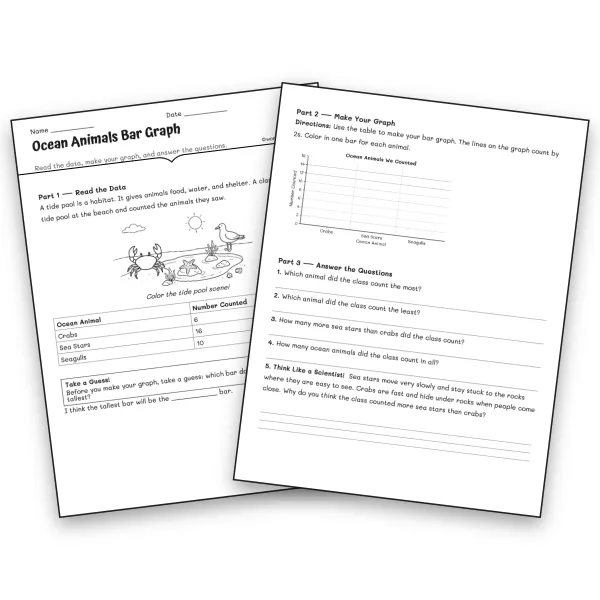
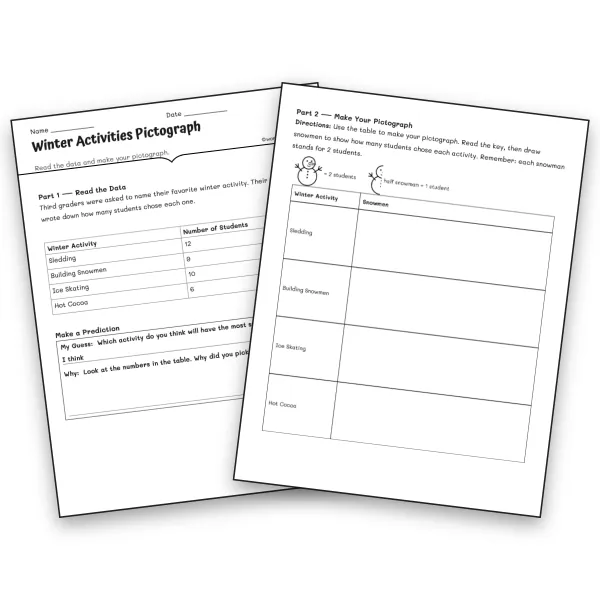
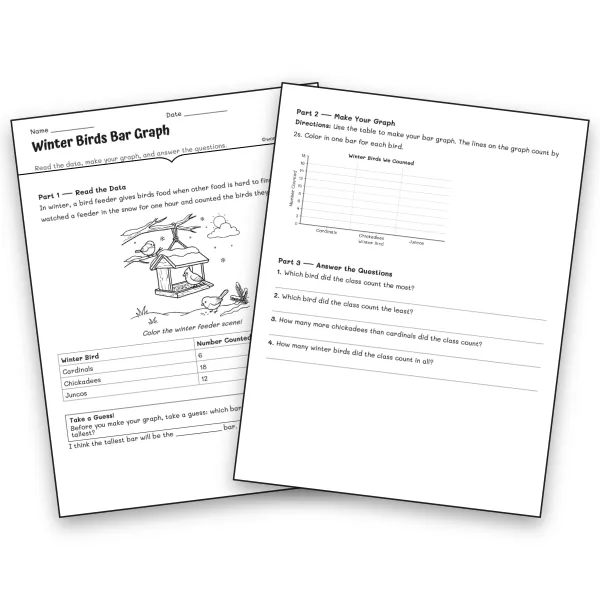
This desert animals bar graph worksheet for 3rd grade turns a desert-habitat animal count into a complete data-and-graphing task. Students read a data table of lizards, roadrunners, and jackrabbits, make a prediction, build a scaled bar graph (the axis counts by 2s), and answer questions that move from reading the graph to comparing and totaling the data.
The worksheet follows a clear three-part arc: Read the Data, Make Your Graph, and Answer the Questions. A “Think Like a Scientist!” item asks students to reason about why the class counted more lizards than roadrunners, connecting the math to a real life-science idea about habitats and how easy different animals are to spot — a natural cross-curricular tie that supports NGSS 3-LS4-3 alongside the math standard it anchors, CCSS 3.MD.B.3.
Everything is print-ready and no-prep: a decorative desert scene students can color, a clean table, a large easy-to-use bar graph, and generous space to draw and write. A one-page answer key with the completed bar graph and sample responses is included, so grading takes seconds. Great for a graphing unit, a math center, morning work, review, or homework. Pairs well with the Pond, Forest, Ocean, and Winter Birds bar graphs in the same series.
Perfect for the way you teach
- Assign in one click
- Track progress per student
- Auto-graded results
- Practice at home
- Print or do on-screen
- Build skill mastery
- Standards-aligned
- Self-paced
- Ready-to-use today