Garden Insects Bar Graph
Interactive worksheet with auto-grading, instant feedback, and printable PDF.
By completing this purchase you agree to our Terms of Use and Privacy Policy. Your subscription renews automatically until you cancel. You can cancel anytime from your account settings. All sales are final and non-refundable. Digital content is available for download in your account immediately upon purchase.
What's included
Garden Insects Bar Graph preview and details
About this worksheet
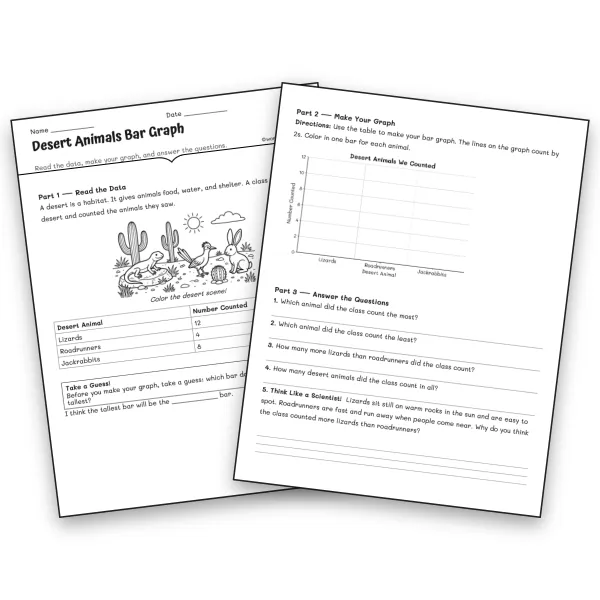
Turn insect curiosity into data skills with this Garden Insects Bar Graph worksheet! Students read a simple data table, make a scaled bar graph, and answer analysis questions about the insects a class counted in a garden. The habitat context connects math practice to life science, so the numbers tell a story students can reason about.
What's included:
- A short habitat introduction and a cute garden coloring scene
- A clear data table (ladybugs, bees, and butterflies)
- A Take a Guess box that gets students predicting before they graph
- A large blank bar graph grid with a scale that counts by 2s
- Four data questions covering most, least, how many more, and how many in all
- A Think Like a Scientist writing prompt that asks students to reason about why so many bees visited the flowers
- A complete answer key with the finished graph
Standards: CCSS 3.MD.B.3, with NGSS 3-LS4-3 as a supporting connection.
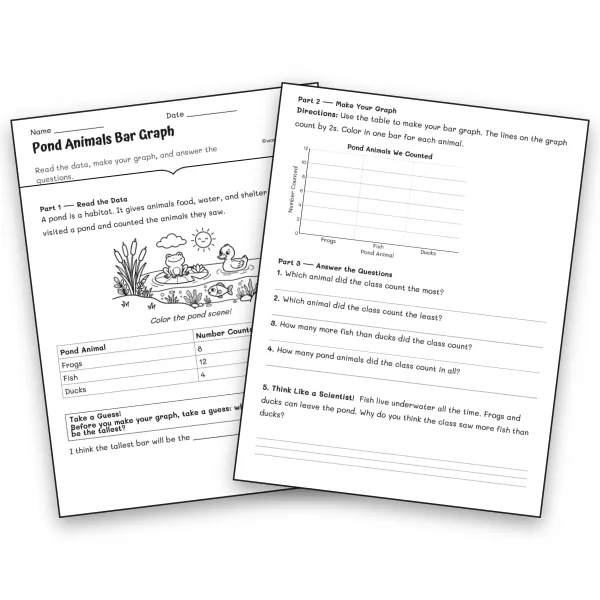
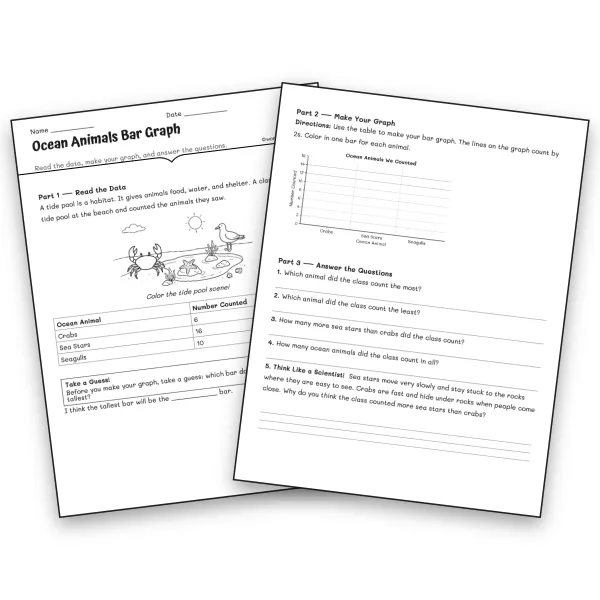
Pairs perfectly with the Pond Animals Bar Graph worksheet for a habitat data mini-set. Print-friendly and low-prep!
Perfect for the way you teach
- Assign in one click
- Track progress per student
- Auto-graded results
- Practice at home
- Print or do on-screen
- Build skill mastery
- Standards-aligned
- Self-paced
- Ready-to-use today