
Weather Forecast - Definition, Examples, Quiz, FAQ, Trivia
Learn how meteorologists predict the weather and how you can understand weather forecasts.
What is a Weather Forecast?
A weather forecast is a prediction of what the weather will be like in the coming hours, days, or weeks. Meteorologists (scientists who study weather) use special tools and technology to make these predictions. They look at patterns in the atmosphere and use computer models to estimate future weather conditions.
Key Concept
Weather forecasts help us plan our activities, prepare for severe weather, and understand how our atmosphere works. The accuracy of forecasts decreases the further into the future they predict.
Types of Weather Forecasts
There are several types of weather forecasts that serve different purposes and timeframes.
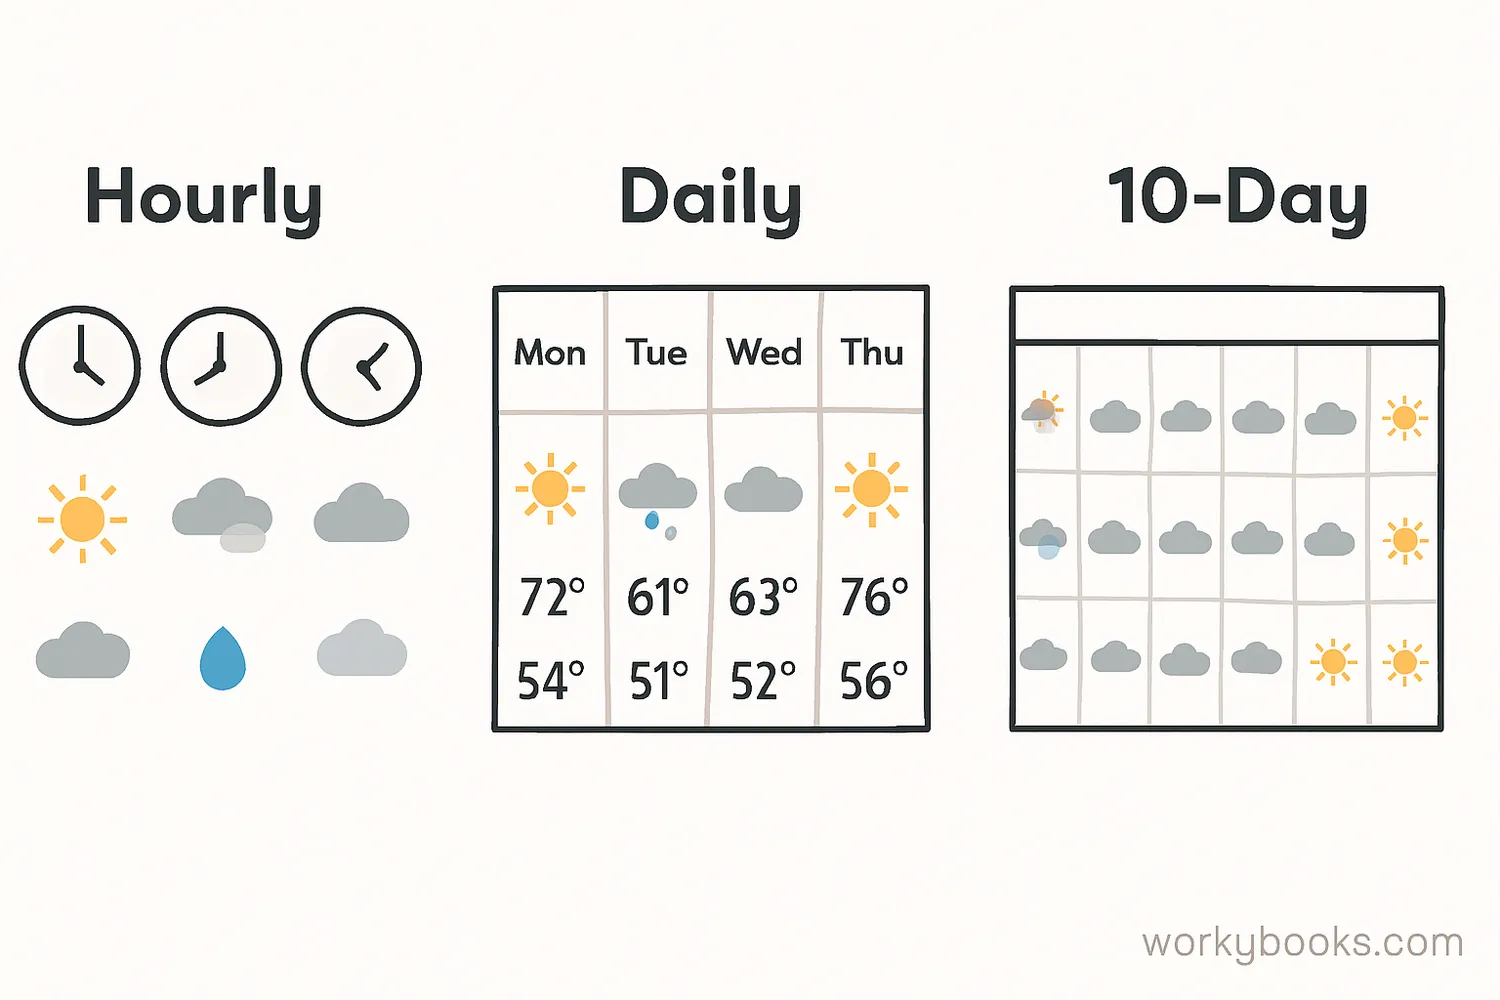
Hourly Forecast
This forecast shows how weather will change throughout the day. It's very detailed and helpful for planning outdoor activities hour by hour. It typically includes temperature, precipitation chance, and conditions.
Daily Forecast
A daily forecast provides information for each day, usually showing high and low temperatures, precipitation chance, and general conditions. This is the most common type of forecast people use for daily planning.
10-Day Forecast
This extended forecast gives a general idea of weather patterns further into the future. While less accurate than shorter forecasts, it helps identify trends and potential weather patterns.
Long-Range Forecast
These forecasts look weeks or months ahead and predict general patterns rather than specific conditions. They're useful for agriculture, energy planning, and understanding seasonal trends.
Forecasting Tools & Technology
Meteorologists use many advanced tools to collect data and create accurate weather forecasts.
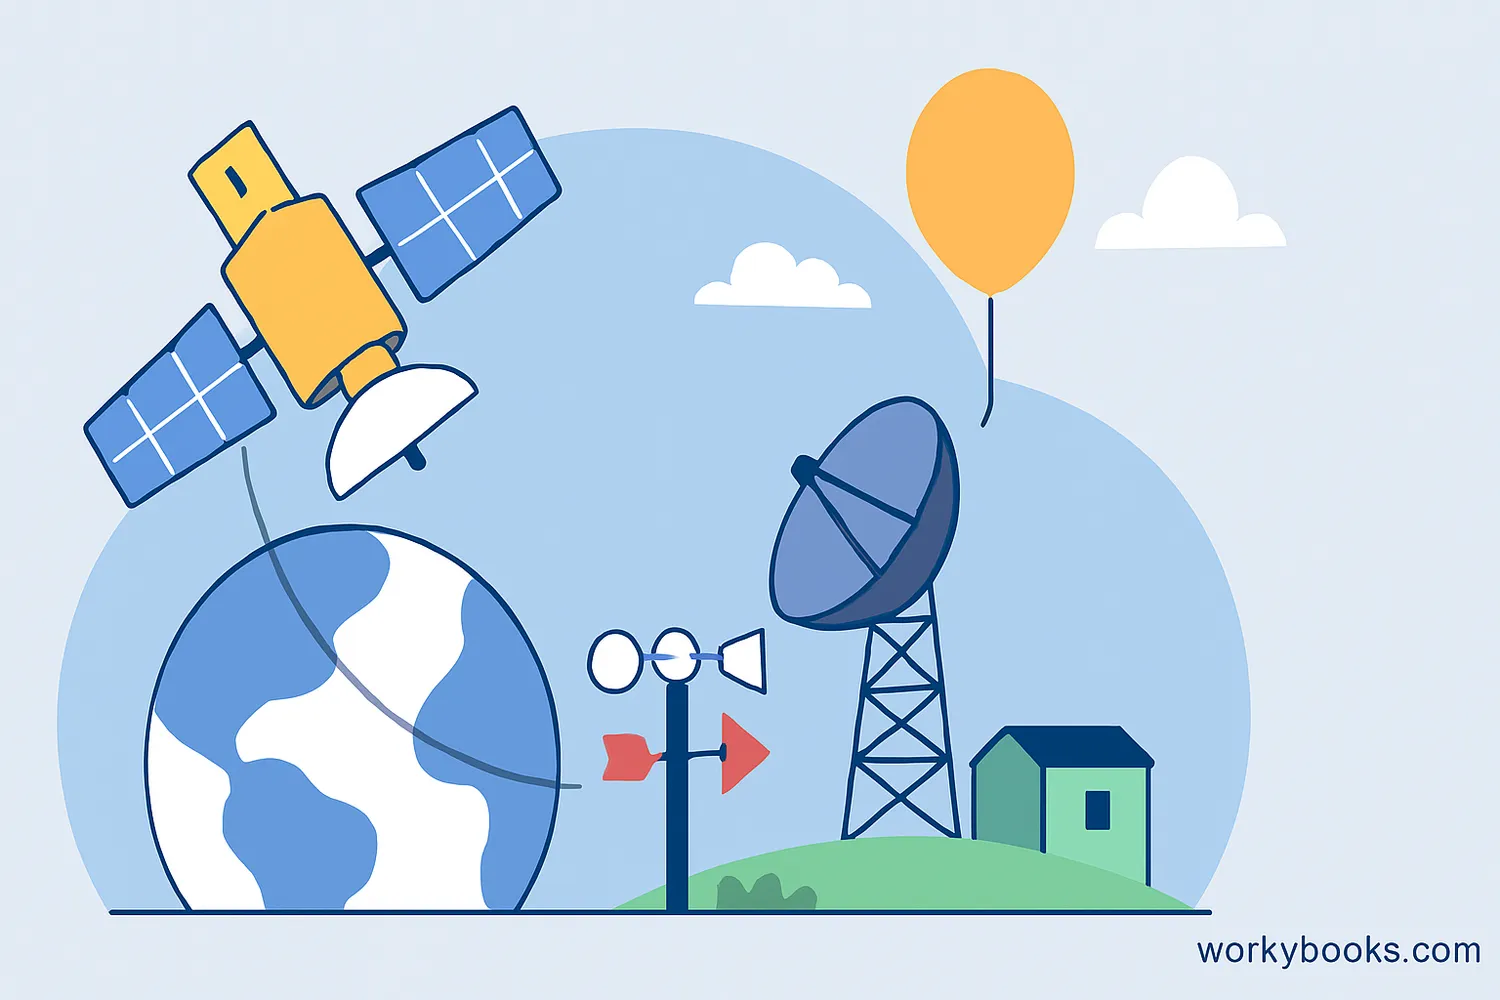
Major forecasting tools include:
- Weather Satellites: These orbit Earth and take pictures of clouds, storms, and other weather patterns from space. They help track large weather systems like hurricanes.
- Weather Radar: Radar uses radio waves to detect precipitation. Doppler radar can also show wind speed and direction, helping to identify severe weather like tornadoes.
- Weather Balloons: These carry instruments high into the atmosphere to measure temperature, humidity, pressure, and wind at different altitudes.
- Weather Stations: Ground-based instruments that measure temperature, humidity, wind, pressure, and rainfall at specific locations.
- Computer Models: Supercomputers process all the collected data using mathematical equations to simulate atmospheric conditions and predict future weather.
How to Read a Weather Map
Weather maps use special symbols and colors to show different weather conditions. Learning these can help you understand forecasts better.
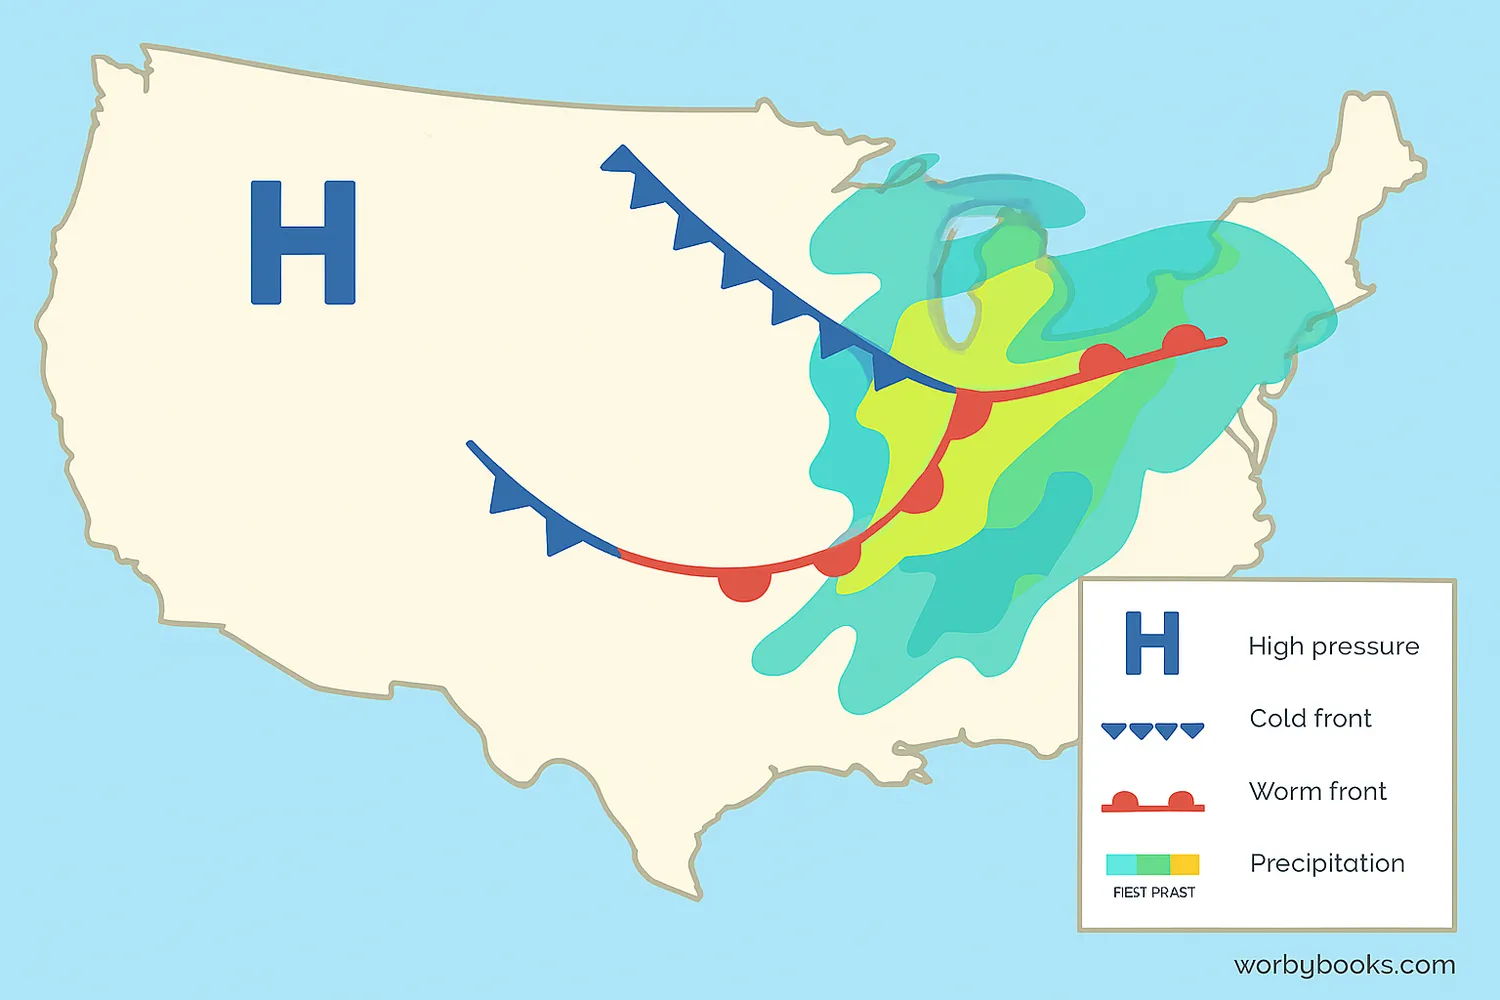
Pressure Systems
High pressure (H) usually brings clear, calm weather. Low pressure (L) often brings clouds, precipitation, and storms. Isobars (curved lines) connect areas of equal pressure.
Fronts
Cold fronts (blue lines with triangles) bring cooler weather and often storms. Warm fronts (red lines with semicircles) bring warmer weather and light rain. Stationary fronts (alternating red and blue) show where air masses aren't moving.
Precipitation
Different colors and symbols show rain (blue), snow (white), or mixed precipitation. The intensity is often shown by how dark the color is - light blue for drizzle, dark blue for heavy rain.
Radar Images
Weather radar shows where precipitation is falling. Green usually indicates light rain, yellow moderate, red heavy, and pink or purple very heavy precipitation or hail.
Weather Forecast Quiz
Test your knowledge about weather forecasting with this short quiz. Choose the best answer for each question.
Frequently Asked Questions
Here are answers to common questions about weather forecasting:
Science Trivia
Here are some interesting facts about weather forecasting:
Ancient Forecasters
People have been trying to predict weather for thousands of years. Ancient Babylonians attempted to predict short-term weather changes based on cloud patterns as early as 650 BCE.
Space Weather Watchers
The first weather satellite, TIROS-1, was launched in 1960. It operated for only 78 days but proved that satellites could be used to monitor weather patterns across the globe.
Supercomputer Power
Modern weather forecasting requires enormous computing power. The supercomputers used for weather prediction can perform quadrillions of calculations per second to process all the atmospheric data.
