
Electronegativity Chart - Definition, Facts, Example, Quiz, Trivia
Discover how atoms attract electrons and why it matters in chemistry!
What is Electronegativity?
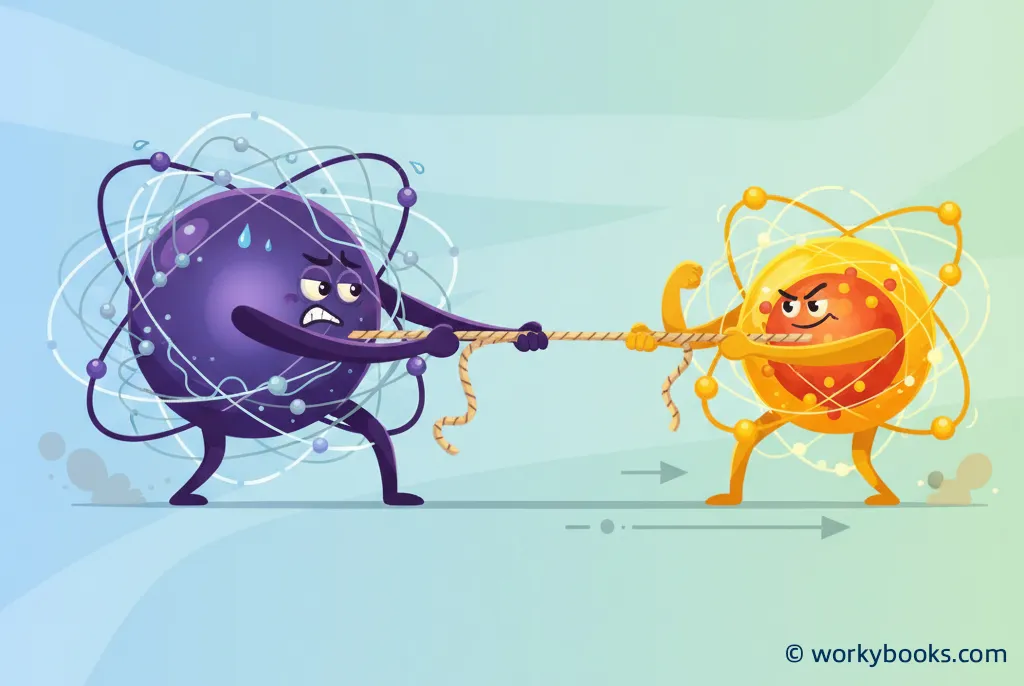
Electronegativity is a measure of how strongly an atom can attract electrons when it forms a chemical bond. Think of it like a game of tug-of-war between atoms - the atom with higher electronegativity pulls the shared electrons closer to itself.
This concept helps us understand how atoms will behave when they form molecules. It explains why some bonds are strong while others are weak, and why some substances dissolve in water while others don't.
Science Fact!
Linus Pauling, an American chemist, developed the first electronegativity scale in 1932 and won the Nobel Prize in Chemistry for his work on chemical bonds.
The Electronegativity Scale
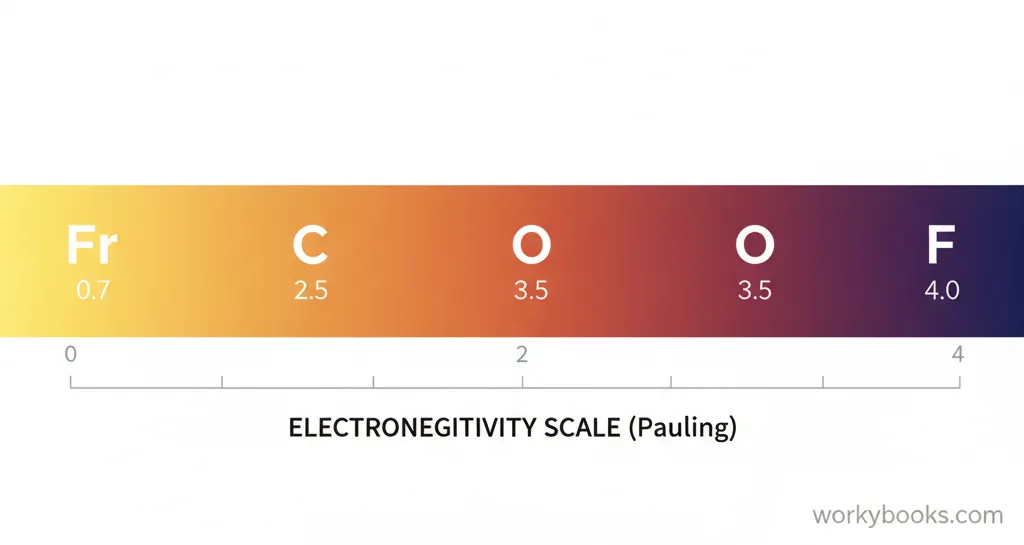
Scientists use different scales to measure electronegativity, but the most common is the Pauling scale. On this scale, values range from about 0.7 (for very weak attraction) to 4.0 (for very strong attraction).
Fluorine is the most electronegative element with a value of 4.0, while francium is the least electronegative at 0.7. Most elements fall somewhere in between these values.
Low Electronegativity
Metals like sodium, potassium, and calcium
Medium Electronegativity
Elements like silicon, carbon, and hydrogen
High Electronegativity
Nonmetals like oxygen, nitrogen, and fluorine
Periodic Table Electronegativity Chart
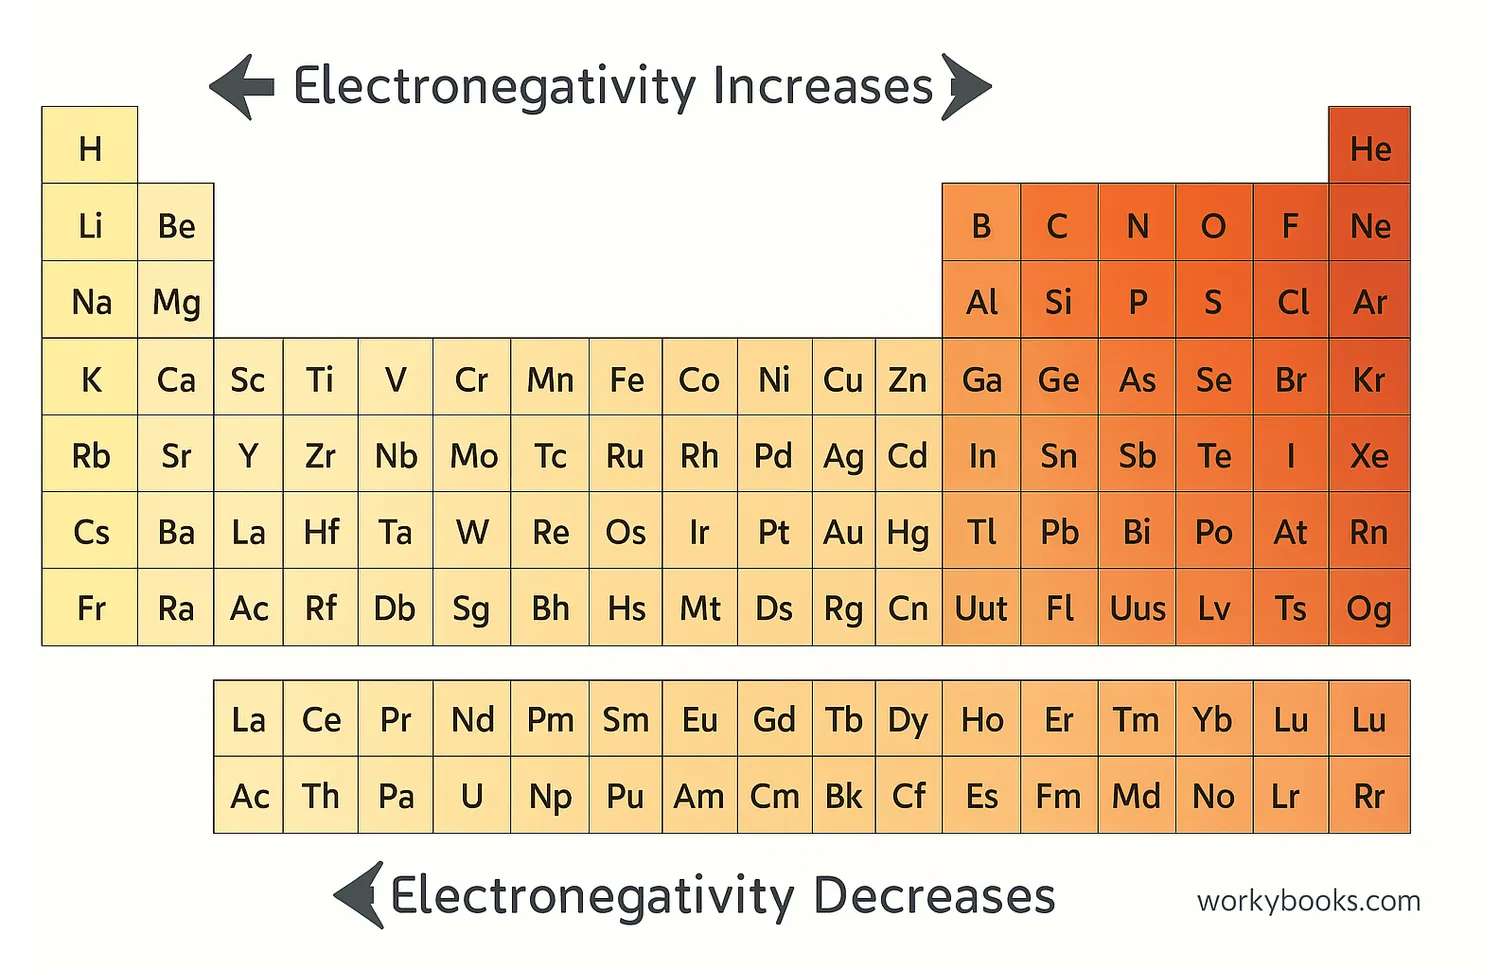
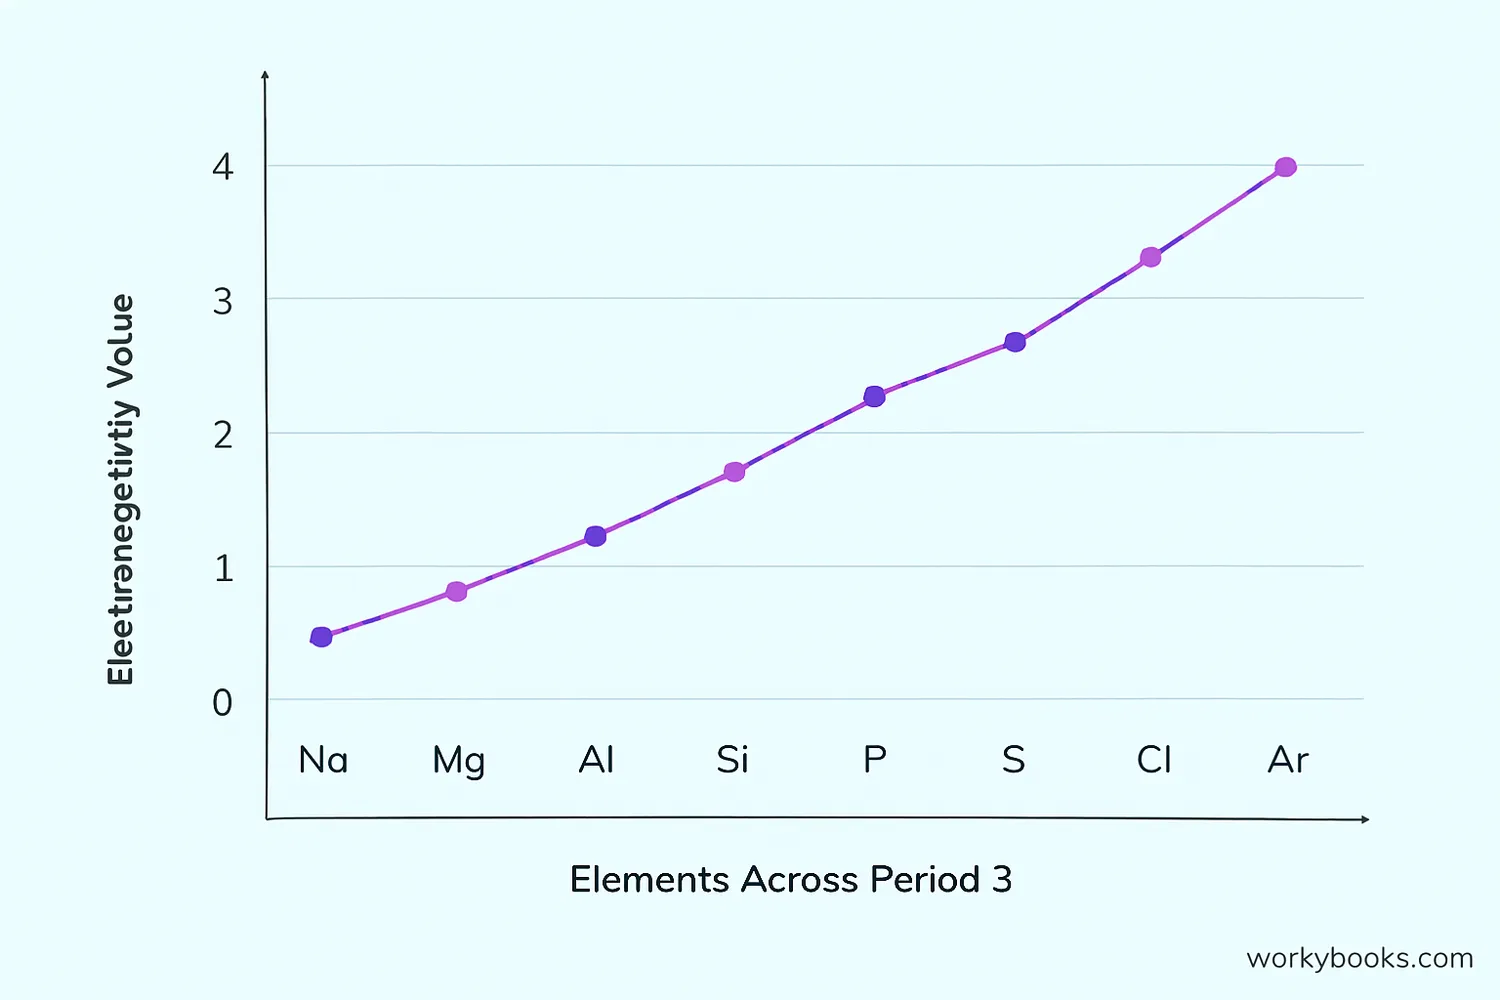
Electronegativity follows specific patterns in the periodic table. Generally, electronegativity increases from left to right across a period and decreases from top to bottom within a group.
This means that elements on the right side of the periodic table (nonmetals) tend to have high electronegativity, while elements on the left side (metals) have low electronegativity.
Electronegativity Values and Trends
Knowing electronegativity values helps predict the type of bond that will form between atoms:
Nonpolar Covalent
Equal sharing of electrons
Polar Covalent
Unequal sharing of electrons
Ionic Bond
Electron transfer occurs
When two atoms have similar electronegativity values (difference less than 0.5), they form nonpolar covalent bonds with equal sharing. With larger differences (0.5-1.9), polar covalent bonds form. When the difference is 2.0 or more, ionic bonds typically form.
| Element | Symbol | Electronegativity |
|---|---|---|
| Fluorine | F | 4.0 |
| Oxygen | O | 3.5 |
| Nitrogen | N | 3.0 |
| Chlorine | Cl | 3.0 |
| Carbon | C | 2.5 |
| Hydrogen | H | 2.1 |
| Sodium | Na | 0.9 |
| Potassium | K | 0.8 |
Electronegativity Quiz
Test your knowledge about electronegativity with this quiz! Answer all 5 questions to see how much you've learned.
Frequently Asked Questions
Here are answers to some common questions about electronegativity:
Science Trivia
Discover some interesting facts about electronegativity!
Double Nobel Winner
Linus Pauling, who developed the electronegativity concept, is one of only four people to have won multiple Nobel Prizes. He won the Nobel Prize in Chemistry in 1954 and the Nobel Peace Prize in 1962.
Why Water is Special
Water's unique properties (like being a liquid at room temperature and having high surface tension) result from the large electronegativity difference between oxygen and hydrogen atoms, creating strong polar bonds.
Not Absolute
An element's electronegativity isn't fixed—it can change slightly depending on what other atoms it's bonded to and its chemical environment. This is why electronegativity values are approximations.
Multiple Scales
Besides the Pauling scale, there are other electronegativity scales including the Mulliken scale, Allred-Rochow scale, and Allen scale. Each uses slightly different methods to calculate values.
