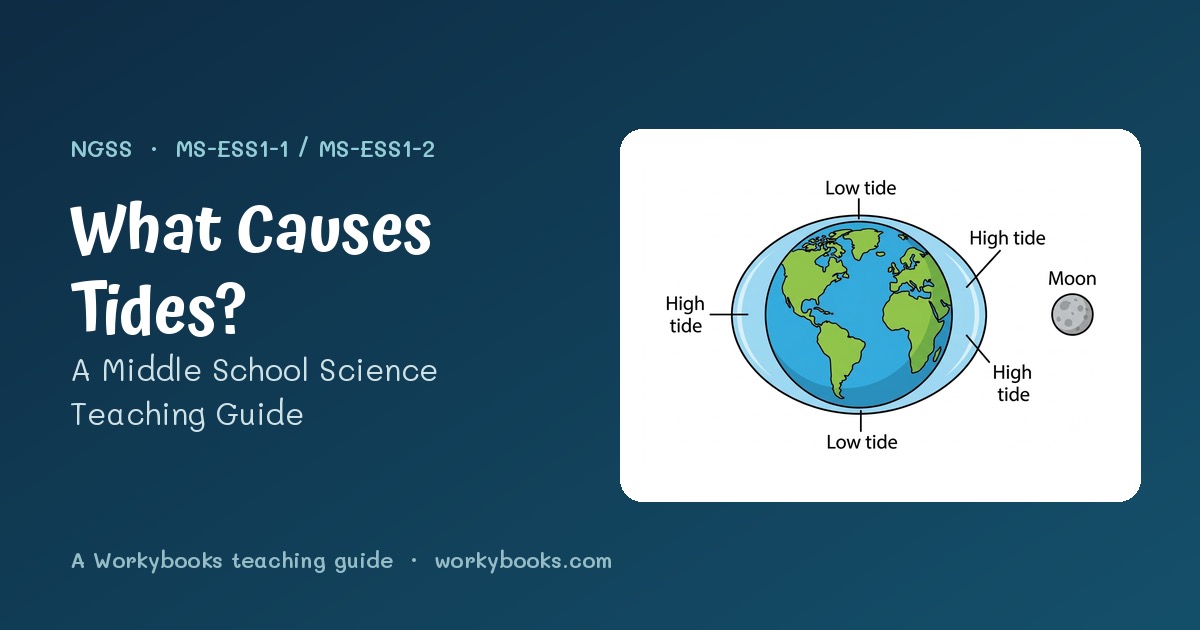
What Causes Tides? A Middle School Science Teaching Guide
Ask a class of middle schoolers what causes tides and most will tell you the Moon “pulls the water up.” They are half right — and that half-right answer is exactly what makes tides such a rich topic to teach. The moment a student tries to explain why there are two high tides a day, the simple picture falls apart, and real model-based reasoning has to take over.
That is also why tides sit so neatly across two NGSS performance expectations. They are a cyclic pattern of the Earth-Sun-Moon system (MS-ESS1-1) driven entirely by the role of gravity (MS-ESS1-2). Teach them well and you are not just covering ocean science — you are giving students a clean case study in using a model to explain a repeating pattern. Here is a sequence that works in middle school science classrooms, along with the visuals and tides worksheets that make each step land.
Step 1 · The causeStart with gravity and the near-side bulge
Begin where the physics begins. Gravity is a pull between any two objects, and it gets stronger the closer they are. The Moon pulls on the whole Earth, but it pulls hardest on whatever is closest — the ocean water on the side facing the Moon. That water piles up into a tidal bulge, and a coast sitting under it experiences a high tide. Students grasp this part quickly; it matches their intuition.

Step 2 · The keystoneTeach the far-side bulge carefully
This is the make-or-break idea, and it is where most resources wave their hands. There is a second tidal bulge on the side of Earth facing away from the Moon. Students find this baffling: how can the farthest point from the Moon also be a high tide?
The answer is comparison, not magic. The Moon pulls the solid Earth toward it more strongly than it pulls the far-side water, because the solid Earth is closer to the Moon than that water is. Earth gets tugged away from the far-side water and leaves it behind — a second bulge. Spend real time here; if students can explain the far-side bulge in their own words, they understand tides.
Step 3 · The patternTwo tides a day, fifty minutes later
Once the two bulges are locked in, the daily pattern falls out for free. Earth rotates once a day, so any coast sweeps through both bulges and both thin spots in between — about two high tides and two low tides every day. And because the Moon keeps moving along its orbit, Earth has to spin a little extra each day to catch up, so high tide arrives roughly 50 minutes later than it did the day before. That single fact connects tides back to Moon phases and sets up everything that comes next.
Step 4 · Bring in the SunSpring and Neap Tides
The Moon causes most of the tide, but the Sun and Moon together decide how big it gets. This is the spring-neap story, and it ties tides directly to the phases students already know.
When the Sun, Moon, and Earth line up in a row — at the New Moon and Full Moon — the Sun’s pull and the Moon’s pull work together. Their bulges add up and you get spring tides: the biggest tidal range of the month. About a week later, at the quarter Moon phases, the Sun and Moon pull at a right angle and partly cancel, giving the small range of neap tides. (Worth flagging the classic trap: “spring” has nothing to do with the season.)

Connecting spring neap patterns to the lunar cycle is the natural bridge from your Moon phases unit — students realize the same geometry that makes phases also sizes the tides.
Step 5 · Make it quantitativeGraphing tides turns the concept into data
Here is where tides become an NGSS data lesson rather than a vocabulary list. Give students a day of tide-height readings and have them plot tide height over time. The graph does the teaching: the two-high, two-low pattern they reasoned about in Step 3 appears as a wave they can measure.

Once the curve is drawn, students can find the time between high tides, calculate the tidal range, and compare a spring-tide day with a neap-tide day using real numbers. That is the data-analysis muscle MS-ESS1-1 is built on, and graphing tides is the single best way to exercise it.
Step 6 · Lock it inA cause-and-effect graphic organizer
Tides are a causal chain — gravity, then two bulges, then rotation, then two tides a day — which makes them perfect for a graphic organizer. Asking students to fill the chain in their own words is the fastest way to surface who still cannot explain the far-side bulge.

The sequenceHow the whole unit fits together
Put together, these pieces make a tight teach-practice-assess arc. Here is the order that works:
- Read the cause — a short brief on what causes tides and the two bulges.
- Read spring and neap — bring in the Sun and the Moon phases.
- Graph the data — plot tide height and measure the tidal range.
- Reason and predict — use the model to predict highs and spring vs. neap.
- Organize the cause — the cause-and-effect graphic organizer.
- Assess — a quiz that rewards explaining, not just recalling.
You can pull any single piece into an existing plan, or run the full ocean tides unit start to finish. Every Workybooks resource is depth-first and answer-key-backed, so the reasoning — not just the labels — is what students practice.
Ready-to-teach resourcesBring tides to your classroom
Grab the graphing activity and the graphic organizer on their own, or get the complete tides bundle — readings, graphing, worksheets, organizer, poster, and quiz — all aligned to MS-ESS1-1 and MS-ESS1-2.
Get the complete Ocean Tides unit Browse individual resourcesWorkybooks builds standards-precise, analysis-first science and math resources for grades K–8. Find more middle school science worksheets and NGSS units at workybooks.com.
Related Posts
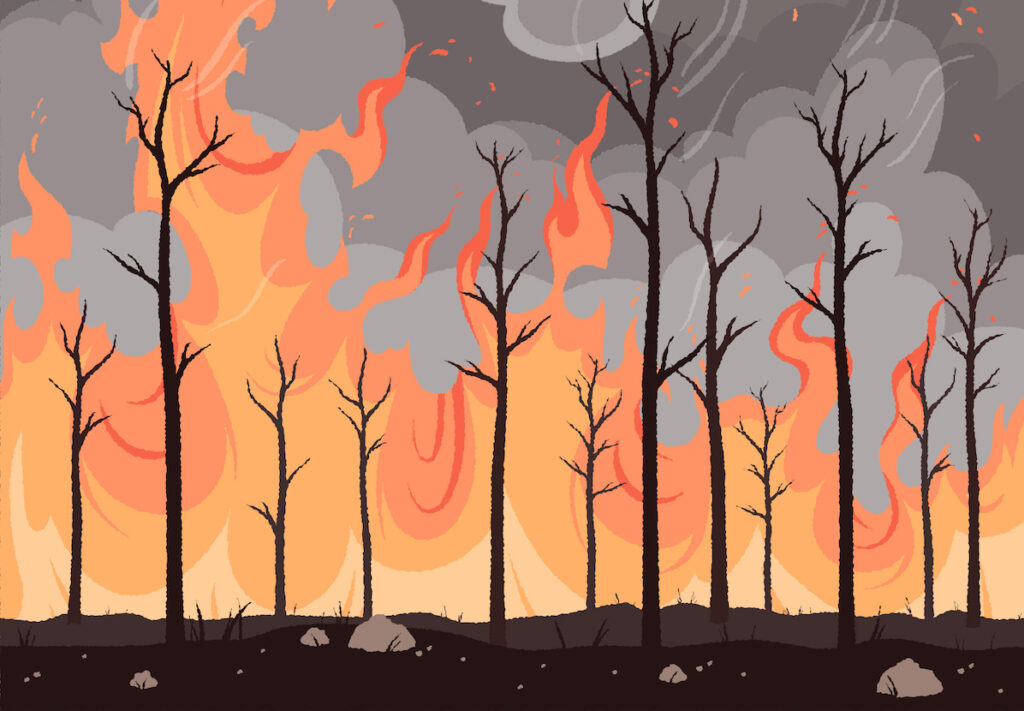
Wildfire Safety Tips: 4th Grade Natural Disaster Worksheet
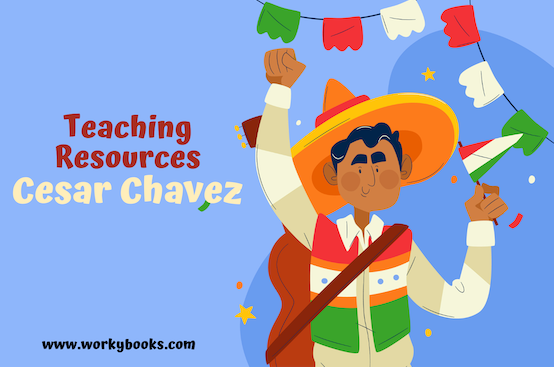
Cesar Chavez Day: Teaching Resources