Graphing Ocean Tides
Interactive worksheet with auto-grading, instant feedback, and printable PDF.
- Format
- Interactive (Online), Printable (PDF)
- Grades
- 678
- Subjects
- science
- Standards
- NGSS. MS-ESS1-1MS-ESS1-2
What's included
About this worksheet
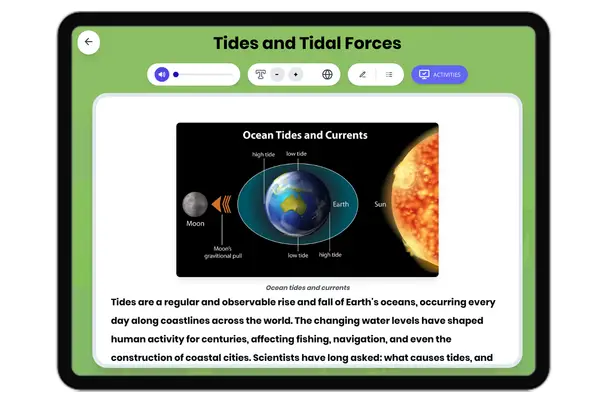
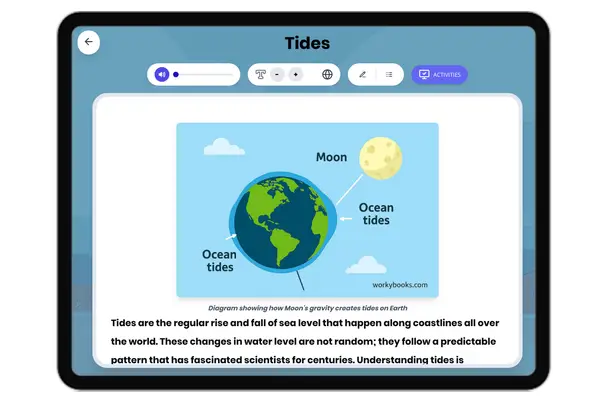
Turn tides into real data analysis with this print-ready graphing activity for NGSS MS-ESS1-1 and grades 6-8. Students plot a full day of tide-height measurements on a labeled grid, connect the points, and then read their own graph to find the daily pattern.
Guided questions walk students through counting the high and low tides, finding the time between high tides, and calculating the tidal range. A second section compares the range on a spring-tide day with a neap-tide day, and a final reasoning section asks students to explain the 50-minute daily shift and what the Sun and Moon were doing to make a large tide.
A complete answer key with the finished graph and sample responses is included, and everything prints cleanly in black and white. This is the data-thinking piece that sets the unit apart, and it folds in the whole tides story as built-in review.
- Plot, read, and analyze real tide data
- Answer key with completed graph
- Aligned to NGSS MS-ESS1-1, grades 6-8
Perfect for the way you teach
- Assign in one click
- Track progress per student
- Auto-graded results
- Practice at home
- Print or do on-screen
- Build skill mastery
- Standards-aligned
- Self-paced
- Ready-to-use today