
Normal Distribution - Definition, Examples, Quiz, FAQ, Trivia
Learn about the bell curve, z-scores, and probability with easy explanations and practice activities
What is Normal Distribution?
A normal distribution is a way that data can be spread out. It's also called a bell curve because it looks like a bell. Many things in nature and daily life follow this pattern.
When we collect data about something (like heights of students in a class), and we plot how many people have each height, we often see this bell-shaped curve. Most people are around the average height, and fewer people are very short or very tall.
The normal distribution is special because it follows a pattern that mathematicians can predict. This helps us understand how likely different outcomes are.
Key Concept
The normal distribution is symmetric - the left and right sides are mirror images of each other.
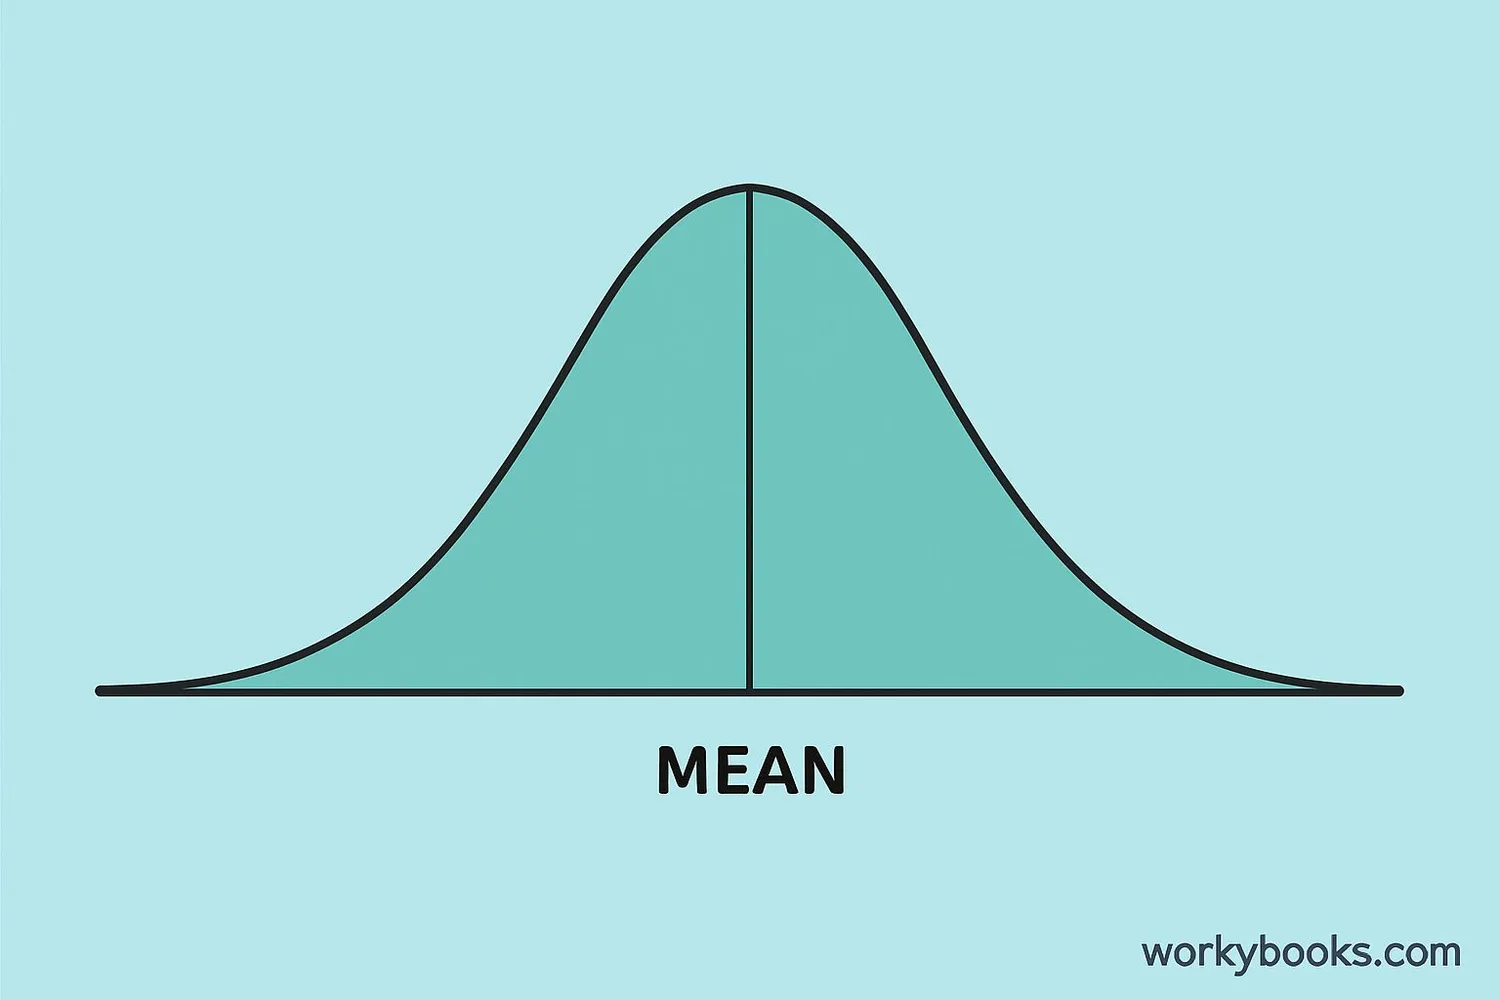
The Bell Curve
The bell curve shows how data is distributed in a normal distribution:
Peak: The highest point in the middle represents the average value (called the mean). This is where most of the data is concentrated.
Tails: The sides that slope down on both ends are called tails. They show the less common values that are far from the average.
Symmetric: The curve is perfectly symmetric - the left side looks exactly like the right side flipped over.
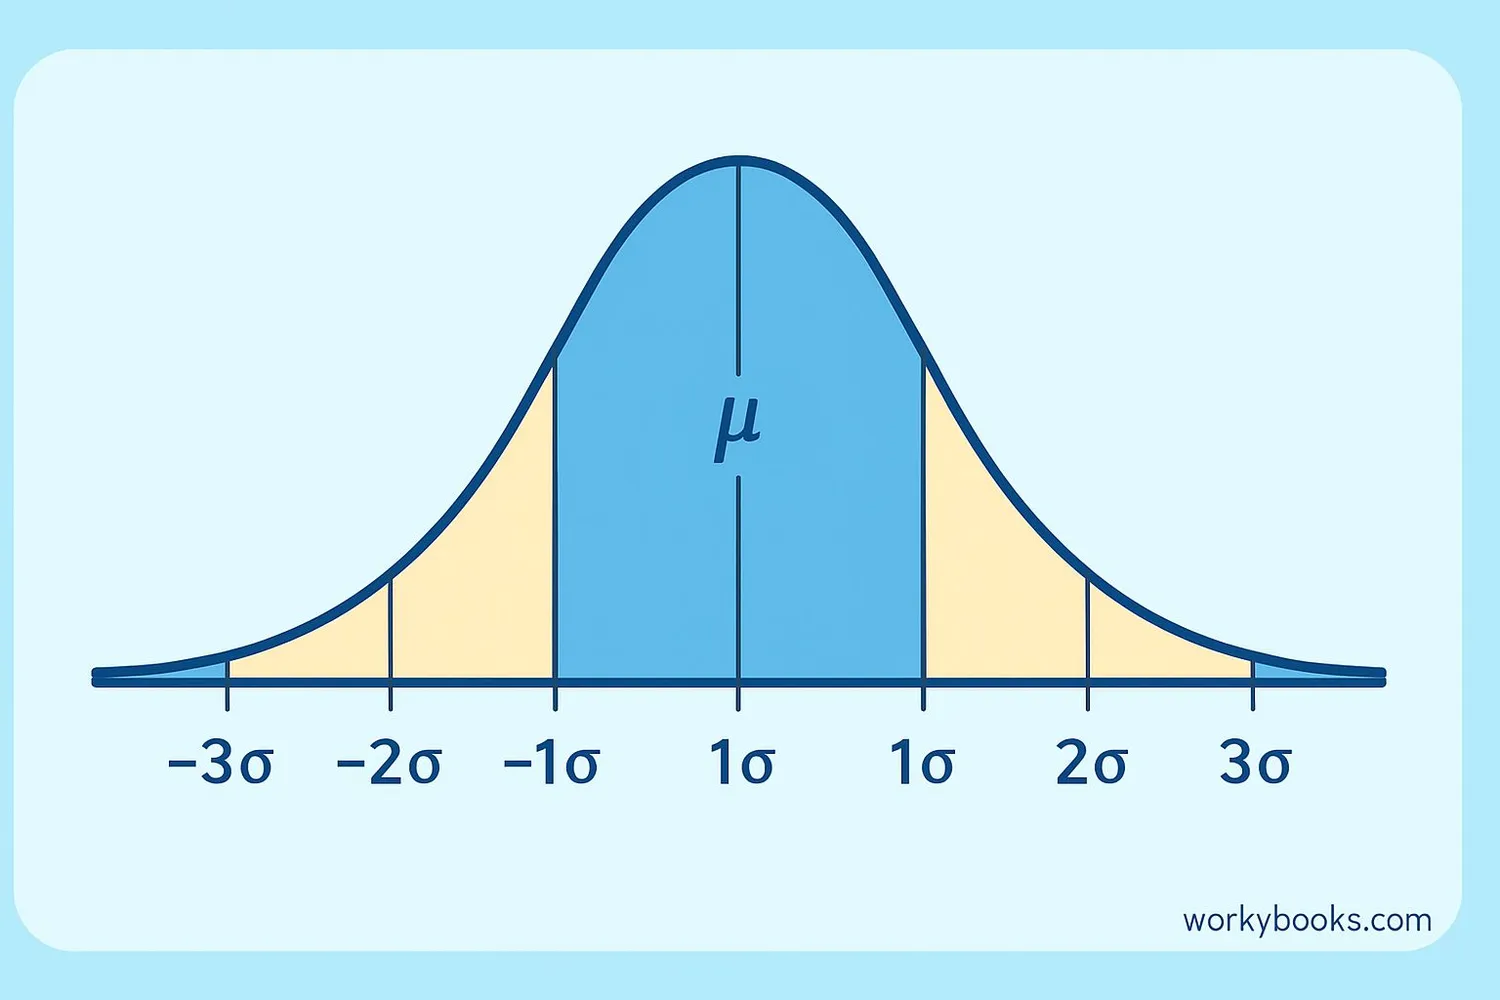
The bell curve helps us understand probabilities. For example, in a normal distribution:
- About 68% of data falls within 1 standard deviation of the mean
- About 95% of data falls within 2 standard deviations
- About 99.7% of data falls within 3 standard deviations
Remember
The bell curve gets its name from its shape - it looks like an old-fashioned bell!
Mean & Standard Deviation
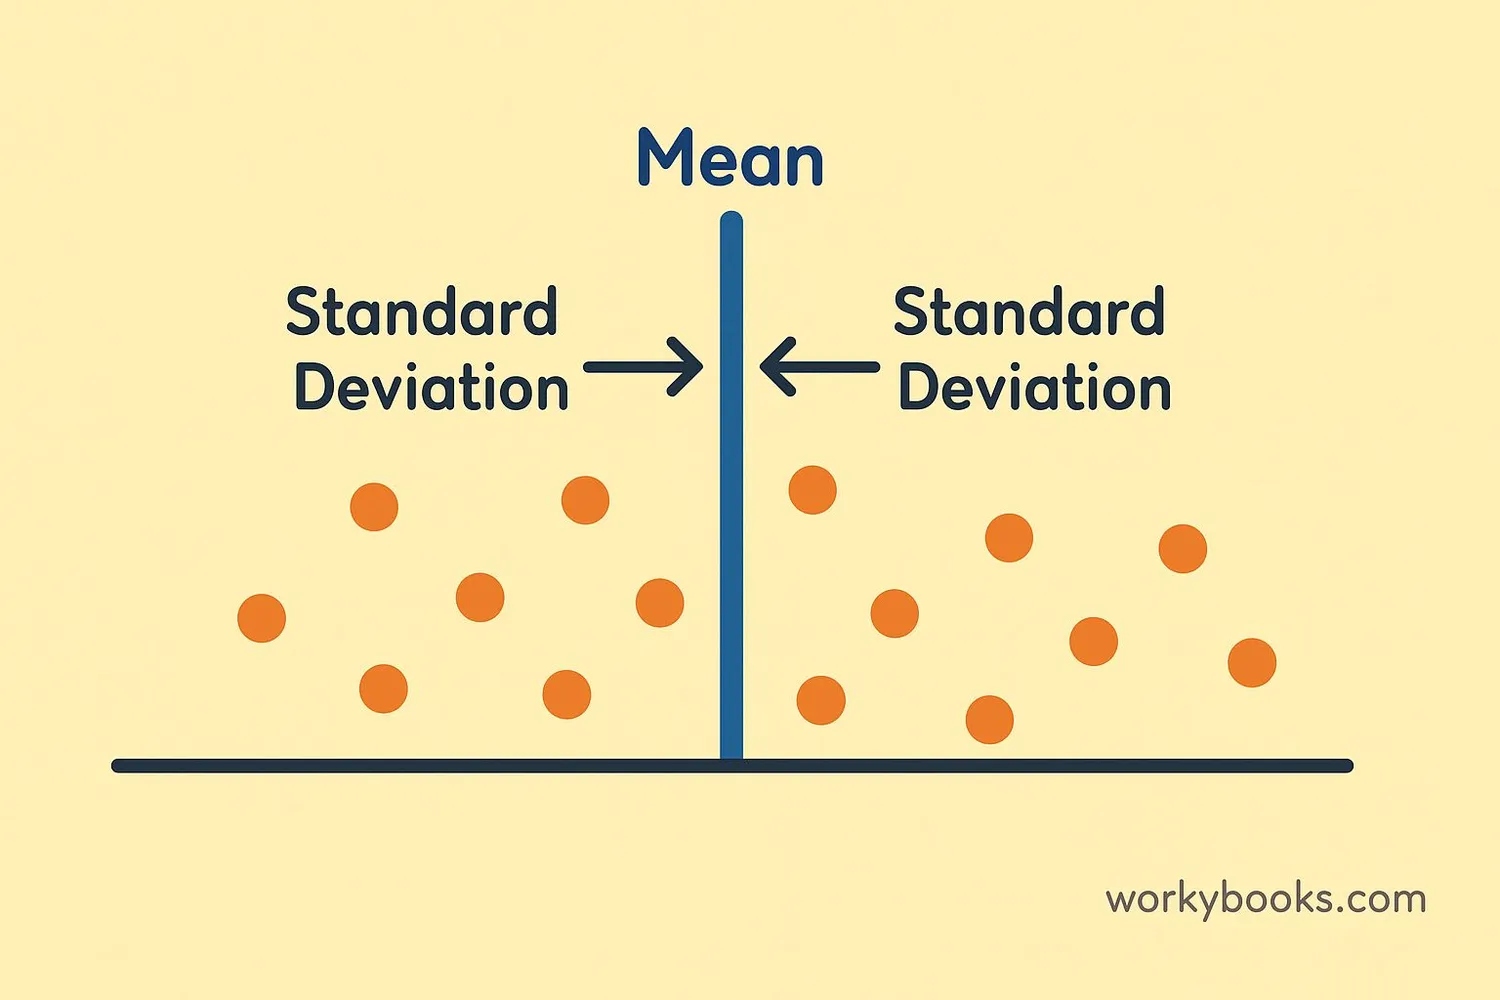
Two important numbers describe a normal distribution:
Mean (μ): This is the average value. It's found by adding up all the values and dividing by how many there are. The mean is at the center of the bell curve.
Standard Deviation (σ): This measures how spread out the data is. A small standard deviation means most data points are close to the mean. A large standard deviation means data points are more spread out.
Standard Deviation Formula
Where xᵢ is each value, μ is the mean, and N is the number of values.
- About 68% of students are between 140-160 cm (mean ± 1σ)
- About 95% are between 130-170 cm (mean ± 2σ)
Math Fact
The standard deviation tells us how "wide" the bell curve is. A bigger standard deviation means a wider, flatter curve.
Understanding Z-Scores
A z-score tells us how many standard deviations a value is from the mean. It's a way to compare different measurements.
Z-Score Formula
Where x is the value, μ is the mean, and σ is the standard deviation.
z = (85 - 80) / 5 = 1.0
This means the student scored 1 standard deviation above the mean. We can use z-scores to:
- Compare scores from different tests
- Understand how unusual a value is
- Find probabilities in a normal distribution
Z-Score Tip
A positive z-score means above average, negative means below average. Zero means exactly average!
Real-World Examples
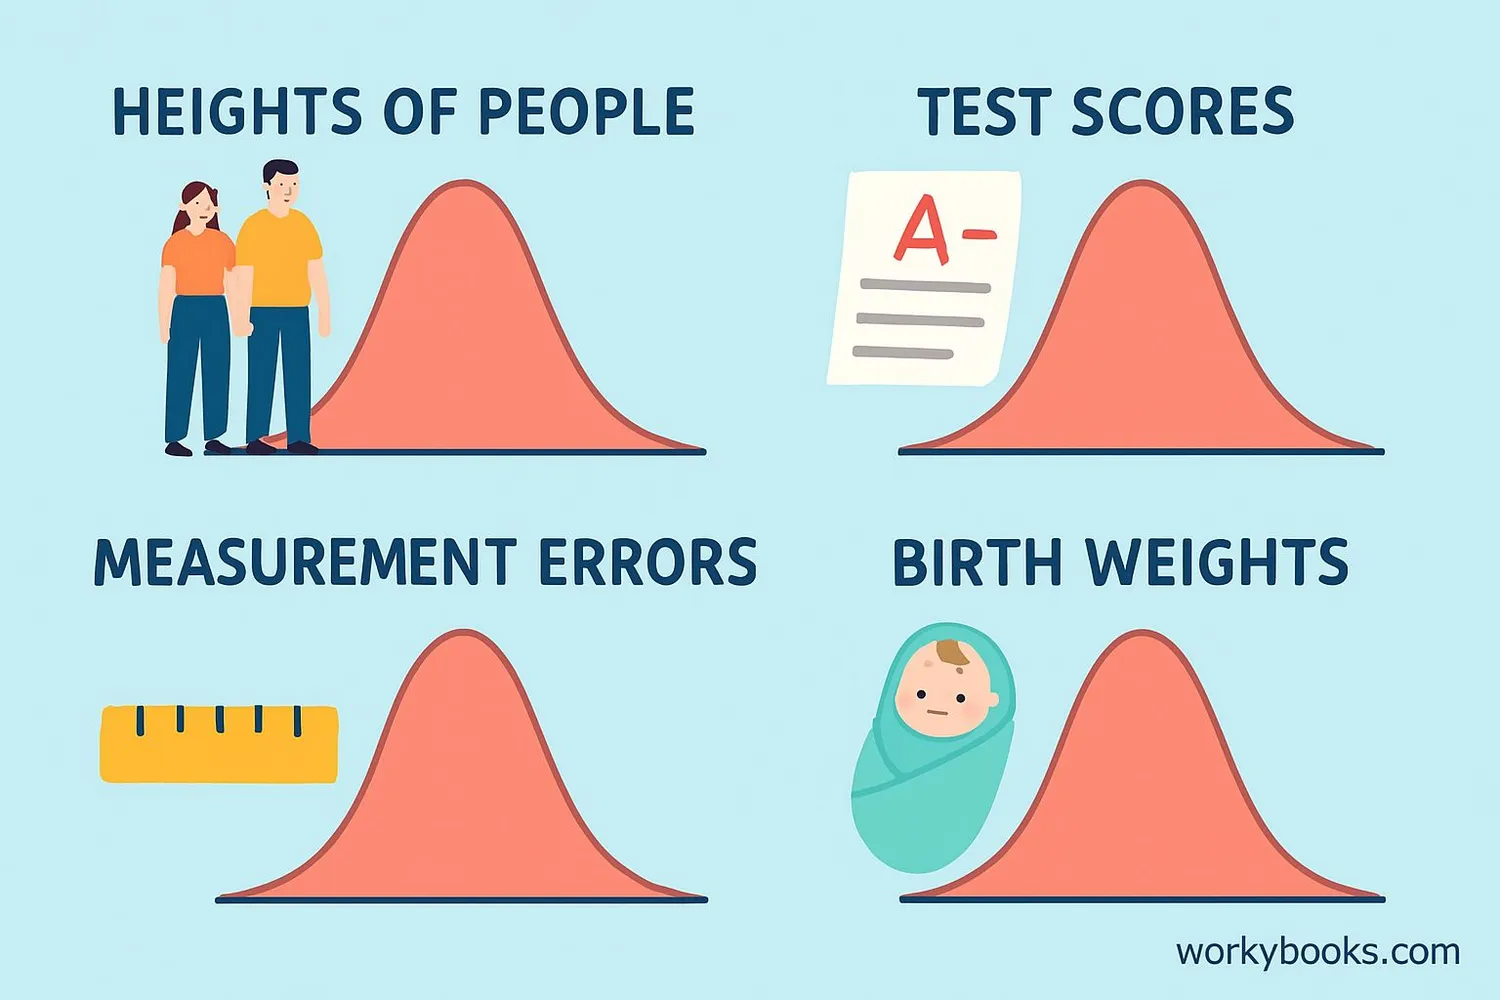
Normal distributions appear everywhere in our world! Here are some common examples:
Heights: The heights of people in a population form a normal distribution. Most people are average height, with fewer very tall or very short people.
Test Scores: When many students take a test, the scores often form a bell curve. Most students get average scores, with fewer getting very high or very low scores.
Manufacturing: When factories make products, small variations in size often follow a normal distribution. This helps quality control.
Nature: Many things in nature follow normal distributions, like the sizes of leaves on a tree or the weights of apples in an orchard.
Example Calculation: In a school, student heights have a mean of 150 cm with standard deviation 10 cm. What height has a z-score of 2?
z = (x - μ) / σ → 2 = (x - 150) / 10 → x = 170 cm
Real-World Tip
Not everything follows a normal distribution! Some data might be skewed or have different patterns.
Normal Distribution Quiz
Test your understanding with this 5-question quiz. Choose the correct answer for each question.
Frequently Asked Questions
Here are answers to common questions about normal distribution:
Math Trivia
Discover interesting facts about normal distribution:
Historical Origins
The normal distribution was first described by Abraham de Moivre in 1733. Carl Friedrich Gauss studied it extensively in the early 1800s, which is why it's sometimes called the "Gaussian distribution".
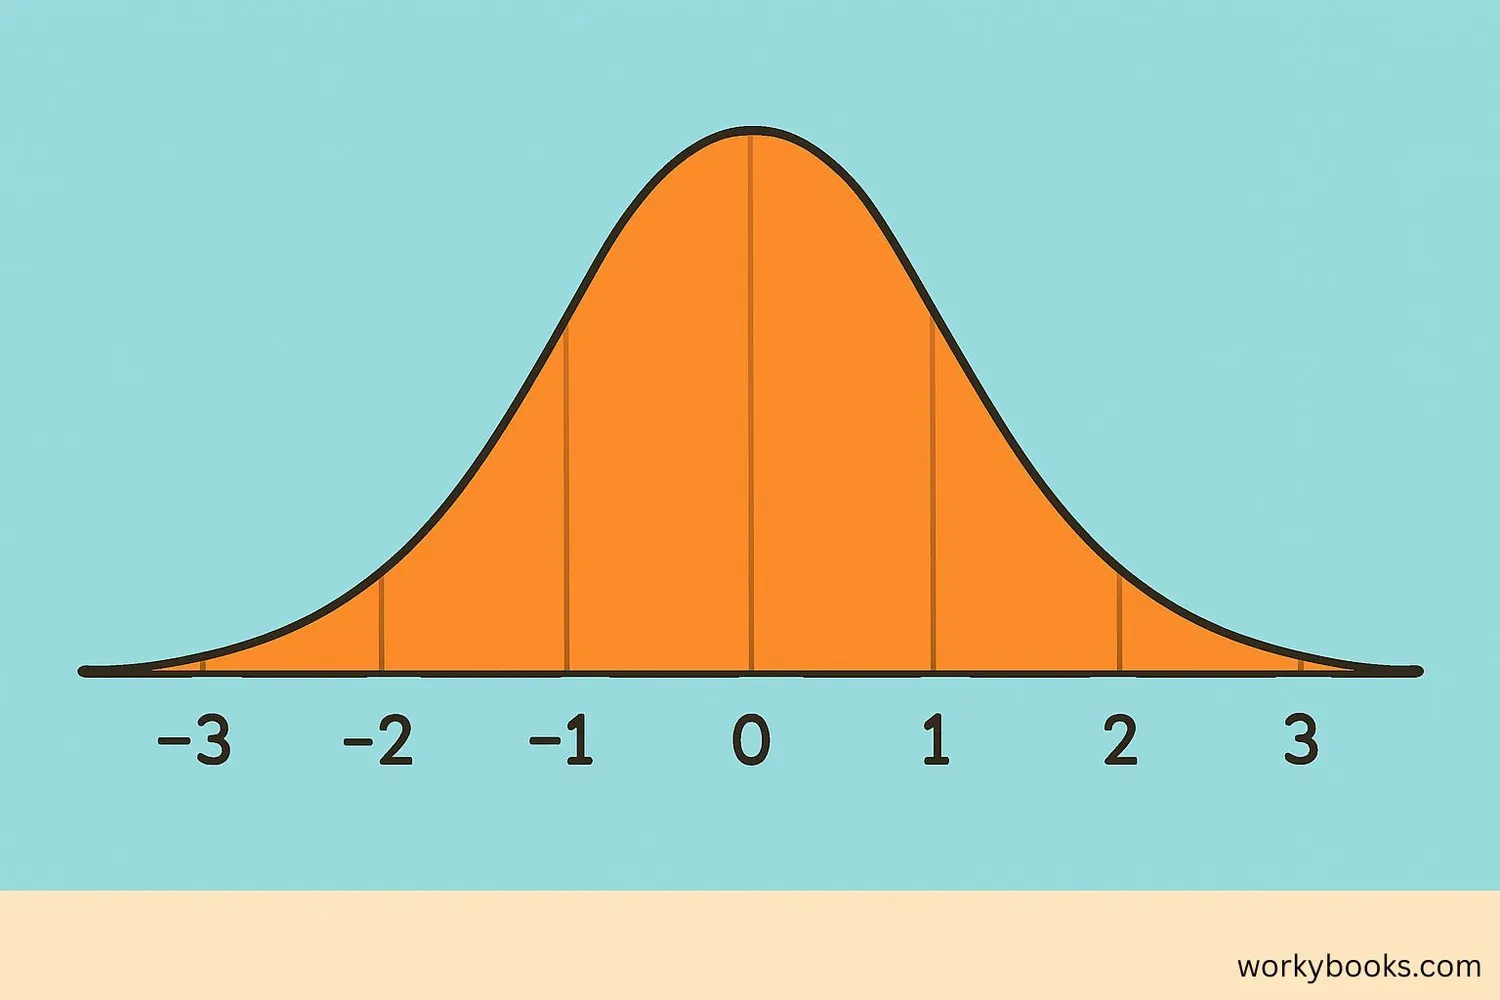
The 68-95-99.7 Rule
This rule (also called the empirical rule) applies to all normal distributions: About 68% of values fall within 1 standard deviation of the mean, 95% within 2 standard deviations, and 99.7% within 3 standard deviations.
Perfectly Normal?
No real-world distribution is perfectly normal! Real data always has some imperfections. The normal distribution is a mathematical ideal that helps us understand and approximate real patterns.
IQ Scores
IQ scores are designed to follow a normal distribution with a mean of 100 and standard deviation of 15. This means about 68% of people have IQs between 85 and 115.
