
Standard Deviation - Definition, Examples, Quiz, FAQ, Trivia
Learn how to measure data spread with easy explanations, examples, and practice activities
What is Standard Deviation?
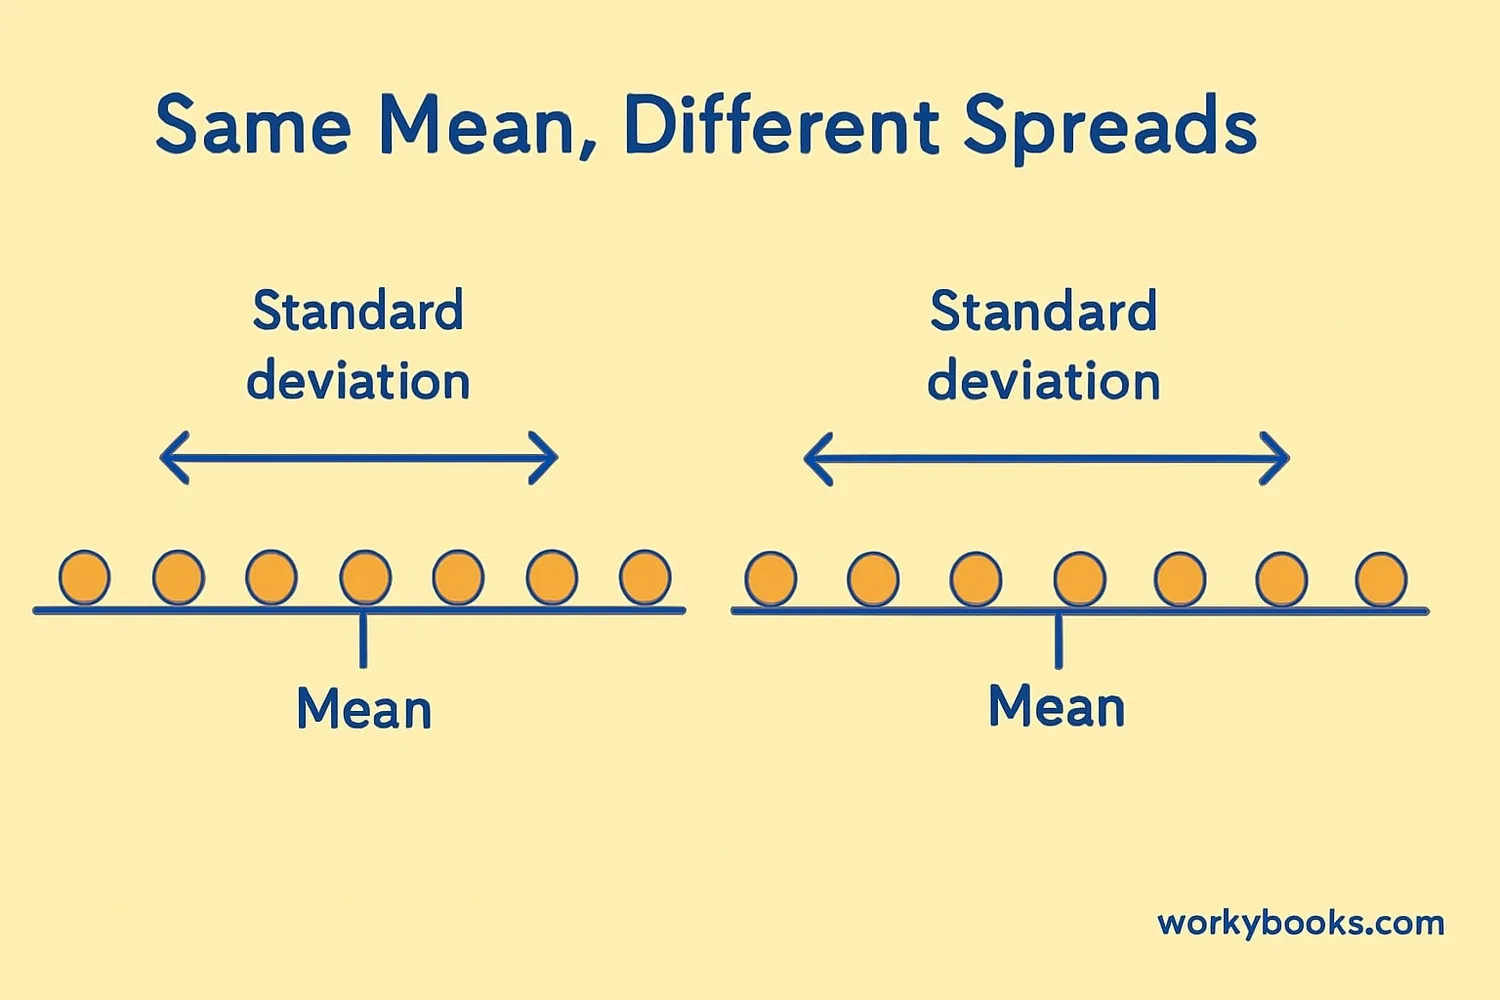
Standard deviation is a way to measure how spread out numbers are in a set of data. Imagine you have a group of students and their test scores. Some students might have high scores, some might have low scores, and others might be in the middle. Standard deviation helps us understand how much these scores differ from the average score.
A small standard deviation means most numbers are close to the average. A large standard deviation means the numbers are more spread out. Think of it like this: if everyone in your class got similar scores, that would be a small standard deviation. If some got very high and some very low scores, that would be a large standard deviation.
In math, we use the Greek letter σ (sigma) for population standard deviation and s for sample standard deviation.
Key Concept
Standard deviation measures how much numbers in a set differ from the average value. A small σ means numbers are close together; a large σ means they're spread apart.
How to Calculate Standard Deviation
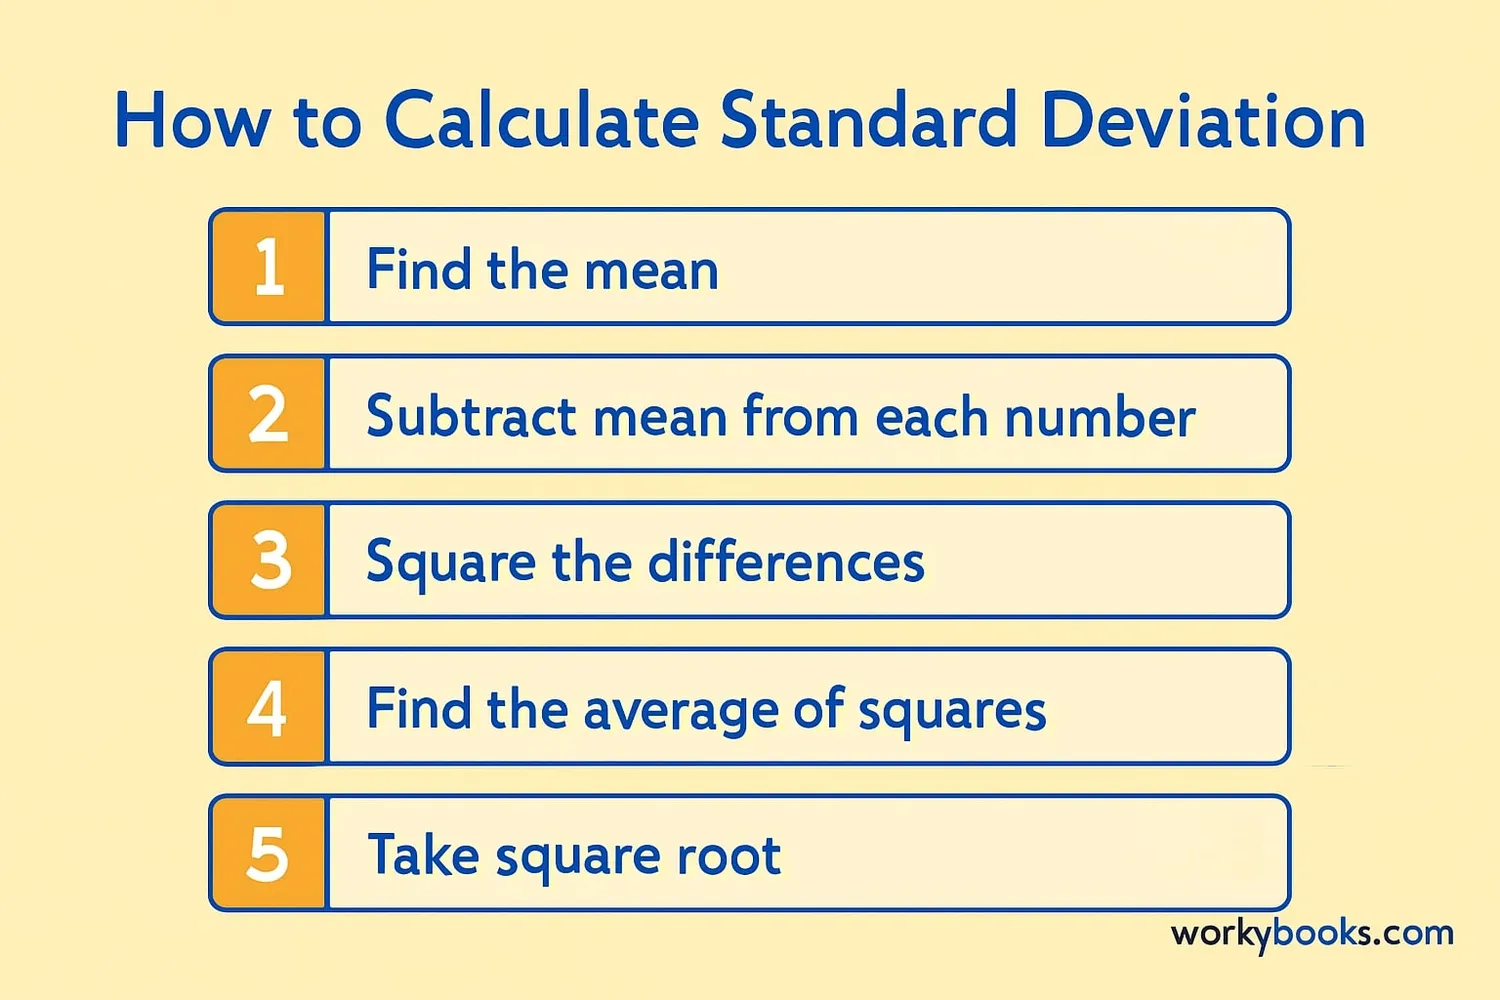
Calculating standard deviation might seem tricky, but it's like following a recipe! Here are the steps:
Find the Mean
Add all numbers together and divide by how many numbers you have
Subtract
For each number, subtract the mean
Square
Square each result (multiply it by itself)
Average
Find the average of these squared numbers
Square Root
Take the square root of that average
Standard Deviation Formula
Where σ is standard deviation, Σ means "sum of", x is each value, μ is the mean, and N is the number of values.
Remember
We square the differences to make all values positive, and then take the square root at the end to bring the number back to the original scale.
Variance and Standard Deviation
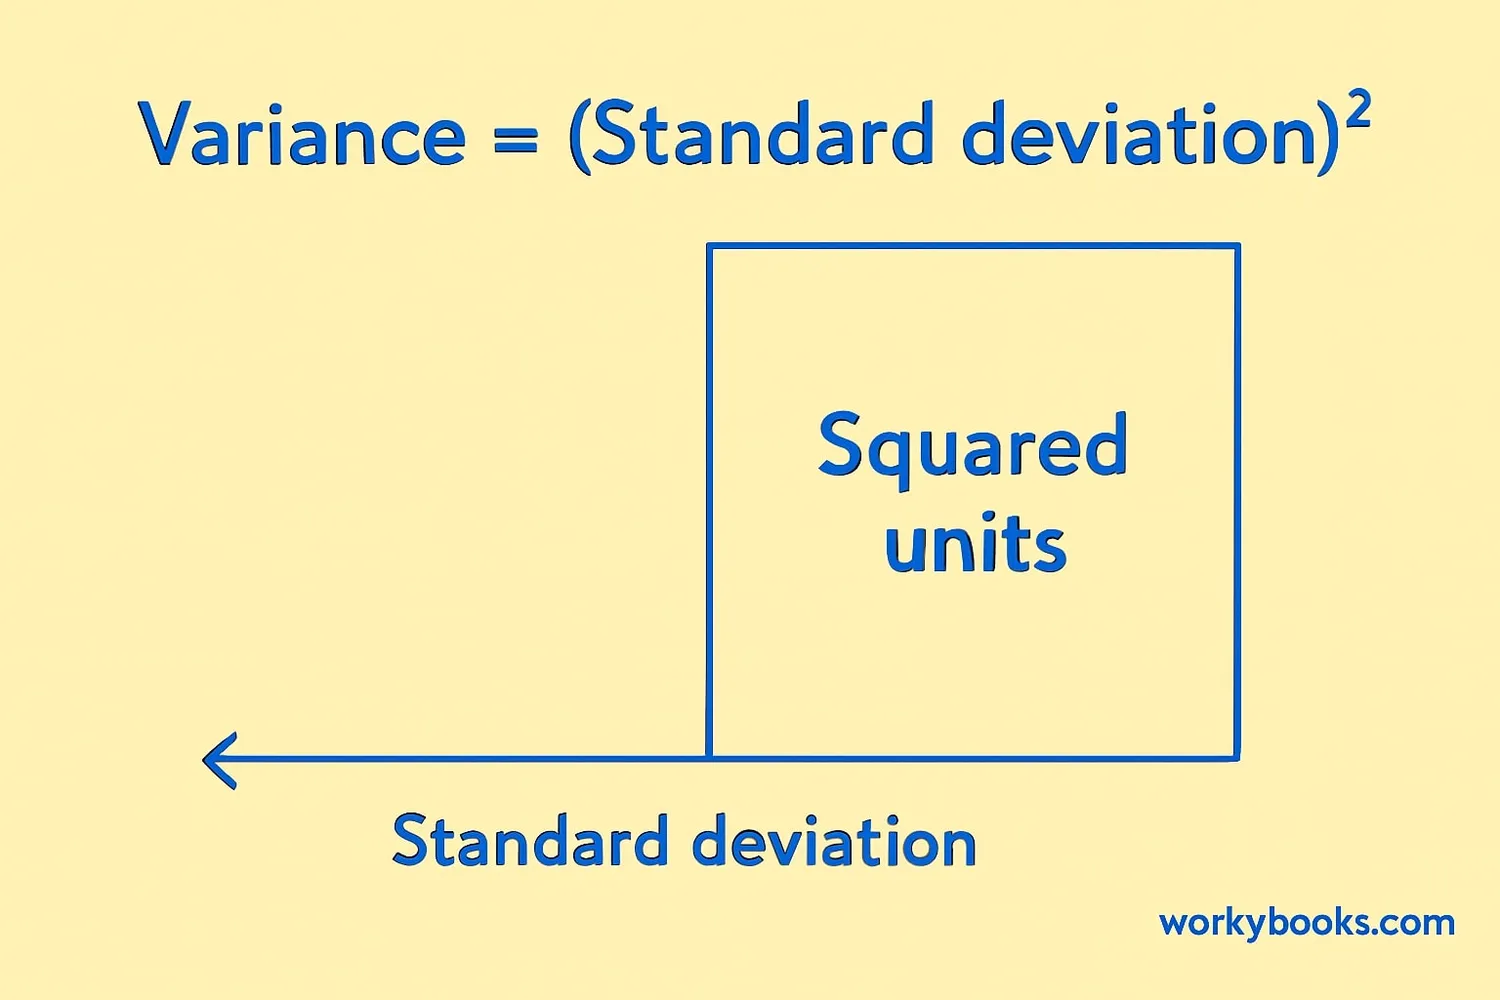
Variance and standard deviation are closely related. In fact, variance is simply the square of standard deviation!
Variance is the average of the squared differences from the mean. It gives us an idea of how spread out the data is, but in squared units.
Standard deviation is the square root of variance. We use standard deviation more often because it's in the same units as our original data, making it easier to understand.
Think of variance like a rough measurement, and standard deviation like the polished final measurement that's easier to work with.
Variance Formula
Where σ² is variance, and the other symbols mean the same as in the standard deviation formula.
Relationship
Standard Deviation (σ) = √Variance
Variance (σ²) = (Standard Deviation)²
Real-World Examples
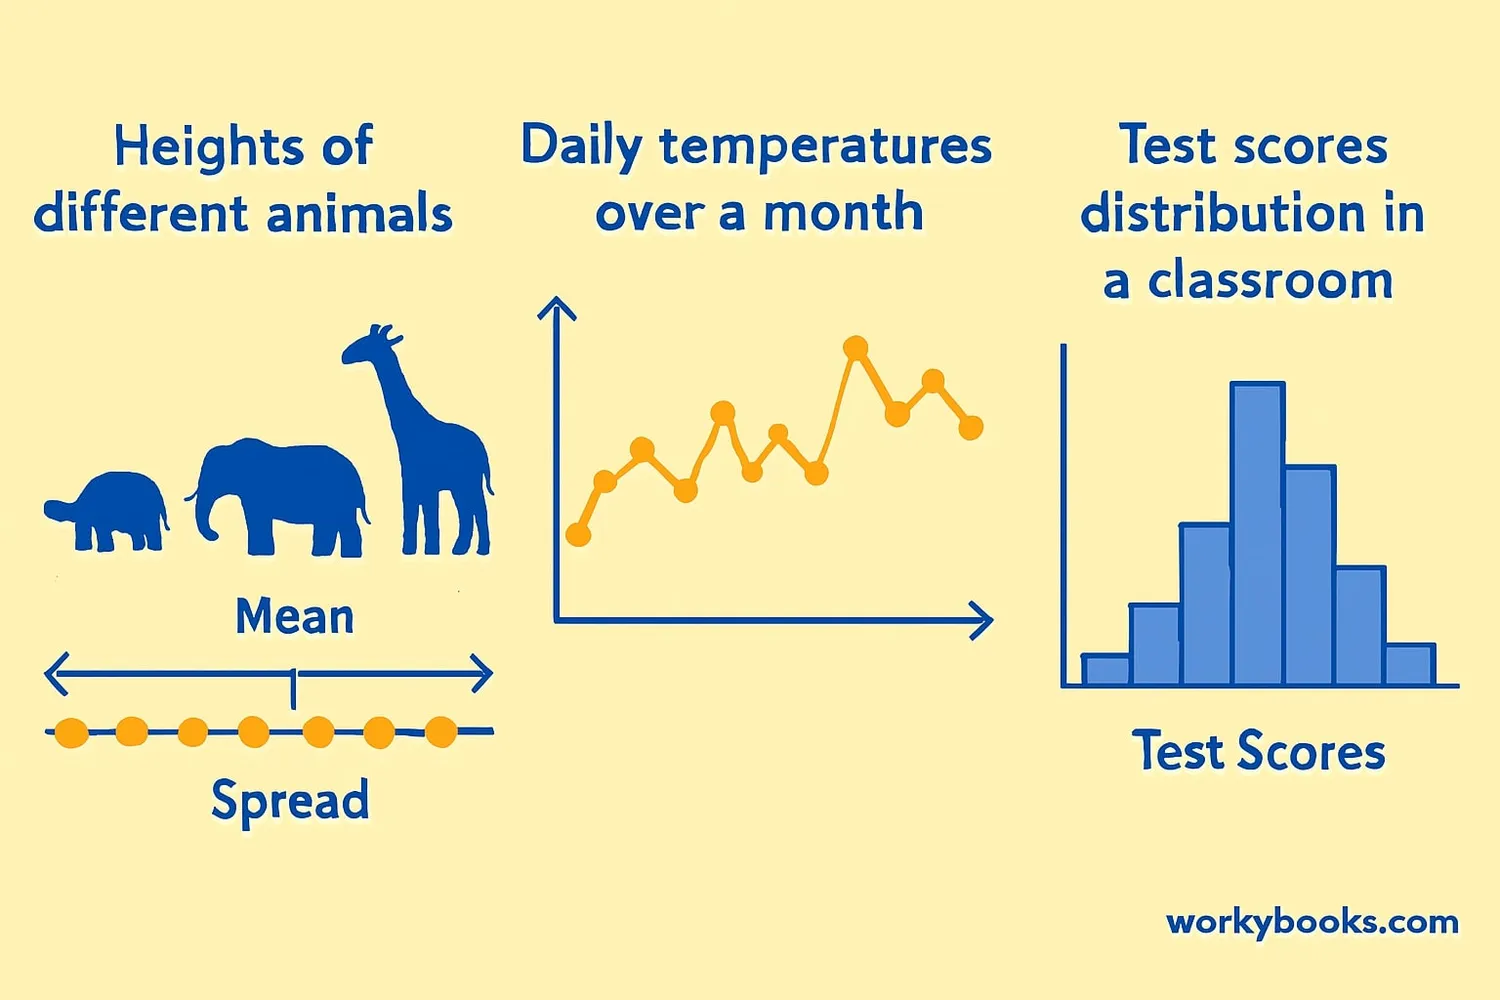
Let's look at some examples to understand standard deviation better:
Example 1: Test Scores
Class A scores: 85, 90, 88, 92, 87 (mean = 88.4, σ ≈ 2.7)
Class B scores: 70, 95, 85, 100, 80 (mean = 86, σ ≈ 11.2)
Class A has a smaller standard deviation, meaning scores are closer together. Class B has a larger standard deviation, meaning scores are more spread out.
Example 2: Weather Temperatures
City A: Daily temperatures: 68°F, 70°F, 69°F, 71°F (σ ≈ 1.1)
City B: Daily temperatures: 55°F, 80°F, 65°F, 75°F (σ ≈ 9.5)
City A has consistent weather (small σ), while City B has more variable weather (large σ).
Example 3: Plant Heights
Group A plants: 10cm, 11cm, 9cm, 10cm, 10cm (mean = 10, σ ≈ 0.7)
Group B plants: 5cm, 15cm, 8cm, 12cm, 10cm (mean = 10, σ ≈ 3.8)
Both groups have the same average height, but Group B plants vary more in height.
Practice Tip
Try calculating standard deviation for the ages of your family members or heights of your classmates!
Standard Deviation Quiz
Test your understanding with this 5-question quiz. Choose the correct answer for each question.
Frequently Asked Questions
Here are answers to common questions about standard deviation:
Math Trivia
Discover interesting facts about statistics and measurement:
Origin of Standard Deviation
The concept of standard deviation was first introduced by Karl Pearson in 1893. He named it "standard deviation" to replace earlier terms like "mean error" that were used to measure variability in data.
Six Sigma Quality
In manufacturing, "Six Sigma" quality means having less than 3.4 defects per million opportunities. This corresponds to having processes where the mean is at least six standard deviations away from the nearest specification limit.
Standard Deviation in Space
NASA uses standard deviation to measure the precision of rocket trajectories. A small standard deviation in flight path calculations helps ensure rockets reach their exact destinations in space.
Consistent Athletes
In sports analytics, players with small standard deviations in their performance scores are considered more reliable. For example, a basketball player with consistent points per game has a smaller standard deviation than one with unpredictable scoring.
