What Causes Seasons?
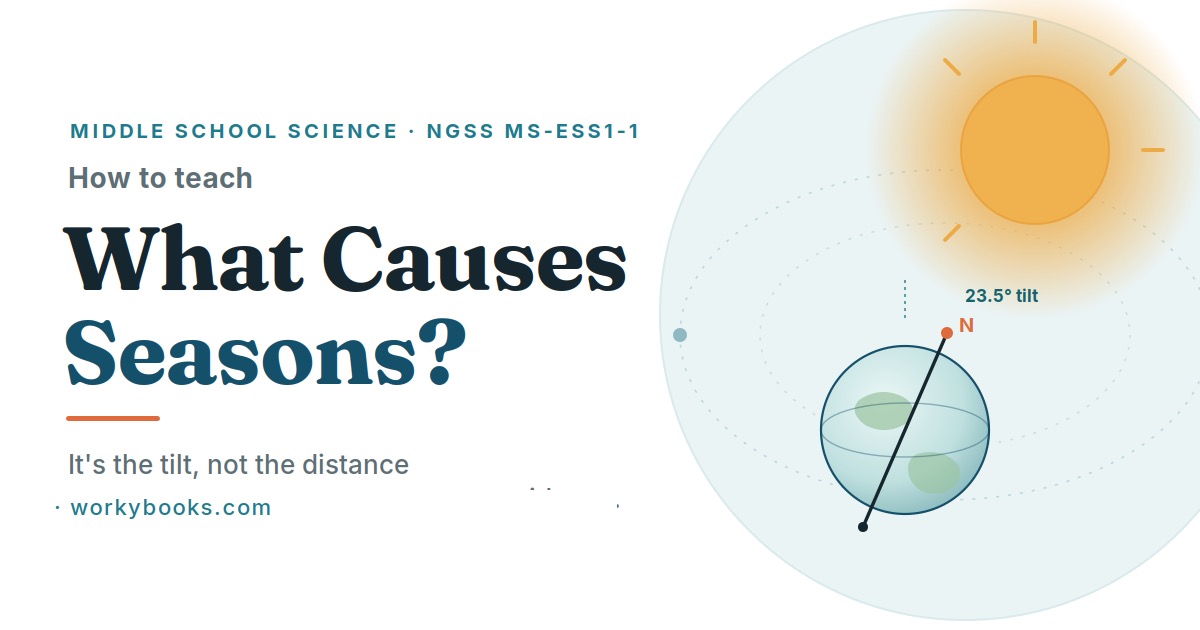
Ask a class of sixth graders why it’s hot in summer and almost every hand goes to the same answer: “Because Earth is closer to the Sun.” It’s one of the stickiest misconceptions in middle school science — and if you don’t confront it head-on, students will memorize the right words for the test and walk out still believing the wrong model.
Seasons sit squarely inside NGSS MS-ESS1-1 — developing and using a model of the Earth-Sun-Moon system to explain a cyclic pattern. Taught well, the topic is more than astronomy trivia: it’s a clean case study in replacing a comfortable wrong idea with a defensible, evidence-based one. Here is a sequence that works in middle school classrooms, with the visuals and worksheets that make each step land.
Step 1 · The misconceptionStart by breaking the wrong model
The fastest way to teach seasons is to make the “closer to the Sun” idea fall apart on its own. The killer fact: Earth is actually closest to the Sun in early January — a point called perihelion — which is the dead middle of Northern Hemisphere winter. If distance caused the seasons, January would be our hottest month. It isn’t. Lead with that contradiction before you introduce any vocabulary.
Two short reading worksheets build the background students need to reason. Why Earth Has Seasons introduces the 23.5° axial tilt and the two mechanisms that flow from it — the directness of the sunlight (sunlight angle) and the length of the day. Opposite Hemispheres & the Sun’s Calendar then explains why the two hemispheres always trade seasons and lays out the four calendar points — the June and December solstices and the March and September equinoxes — in a clean reference table.
Step 2 · The mechanismTilt makes light direct or slanted
Seasons come from tilt, not distance — and tilt works through two levers. The first is the sunlight angle. When the Sun is high, its rays strike the ground nearly straight on and pile their energy into a small patch. When the Sun is low, the same rays hit at a slant and smear that energy across a much larger patch, so every square meter of ground gets less. A flashlight aimed straight down versus aimed at a slant makes the point in ten seconds.
The second lever is day length. The hemisphere tilted toward the Sun gets more hours of daylight to soak up that energy; the hemisphere tilted away gets fewer. Longer, more direct days warm the ground; shorter, slanted days let it cool. Tilt drives both at once — and that’s the whole engine of the seasons.
Step 3 · The modelThe axis stays parallel all year
This is the part most textbooks get wrong, and it’s the keystone of the whole unit. As Earth travels around the Sun, its axis doesn’t wobble to follow the Sun — it points in the same direction in space the entire orbit. The North Pole always aims at the same spot in the sky (near Polaris). The seasons happen because the axis stays fixed: at one end of the orbit the North Pole leans toward the Sun, and half a year later, with the axis still pointing the same way, it leans away.
Step 4 · The evidenceReading the Sun’s calendar
This is the piece I’m proudest of. The graphing activity, Reading the Sun’s Calendar, gives students real day length data for two cities at the same latitude — one north of the equator, one south — and has them plot both on one grid. The two curves come out as near-perfect mirror images that cross at the equinoxes.
That graph is the evidence that ends the debate. Both cities sit the same distance from the Sun at every moment, yet their seasons are opposite. Distance can’t explain that — only tilt can. Pair the graph with a short claim-evidence-reasoning prompt and students are doing real data analysis, not just coloring.
Step 5 · The argumentDistance vs. tilt (CER)
Once students have the reading and the data, it’s time to make them argue. Distance vs. Tilt is a CER worksheet built around argument from evidence. Students compare two competing models — tilt versus distance — predict what each one expects to see, check those predictions against real observations, and write a structured claim, evidence, reasoning paragraph. The design leads them to discover that zero evidence supports the distance model. That’s the heart of NGSS MS-ESS1-1 as a science-and-engineering practice, not just a content standard.
Step 6 · Consolidate & assessTrace the whole chain
To pull it together, the cause-and-effect graphic organizer traces the full chain from tilt all the way to season — and contrasts the two hemispheres side by side.
Then two assessments check mastery: a 10-question quiz and a select-all-that-apply version that forces students to evaluate every option. Finally, the Reason for Seasons poster anchors the room as a reference all unit long.
The sequence at a glanceA simple teaching order
- Read — Why Earth Has Seasons + Opposite Hemispheres (the theory layer).
- Visualize — the diagram-rich engagement sheet (flashlight + orbit labeling).
- Analyze — Reading the Sun’s Calendar graphing activity.
- Argue — Distance vs. Tilt CER / argument from evidence.
- Organize — the cause-and-effect graphic organizer.
- Assess — two quizzes that reward explaining, not just recalling.
- Anchor — the Reason for Seasons poster on the wall.
Taught this way, students don’t just pass the seasons worksheet — they can explain the winter solstice, defend the tilt model with evidence, and spot the “closer to the Sun” misconception in someone else’s reasoning.
Ready-to-teach resourcesTeach seasons the right way
Grab the graphing activity and the CER worksheet on their own, or get the complete Seasons bundle — readings, modeling, data, argument, organizer, poster, and quizzes — all aligned to MS-ESS1-1.
Get the complete Seasons unit Browse individual resourcesWorkybooks builds standards-precise, analysis-first science and math resources for grades K–8. Find more middle school science worksheets and NGSS units at workybooks.com.
Related Posts
Understanding Extreme Weather Events and Climate Change
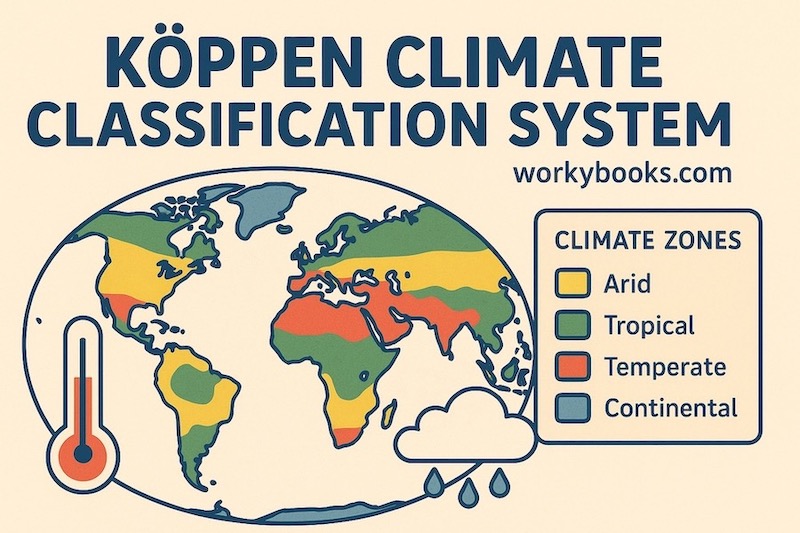
Importance of Köppen Climate Classification System