
Worksheets on Common Core Standard - RI.4.7
RI.4.7 - Interpret information presented visually, orally, or quantitatively (e.g., in charts, graphs, diagrams, time lines, animations, or interactive elements on Web pages) and explain how the information contributes to an understanding of the text in which it appears.
(14 results)Common Core Standard Worksheets
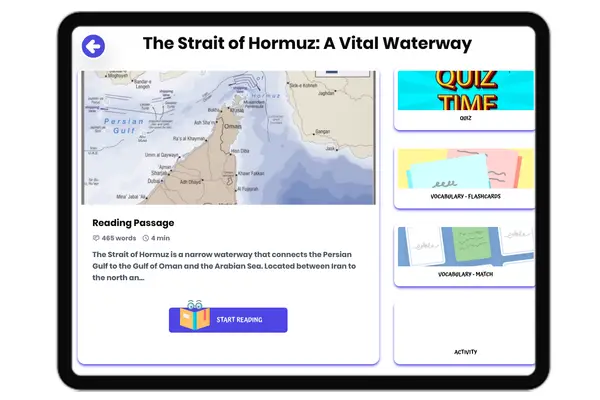
The Strait of Hormuz: A Vital Waterway
CCSS.ELA-LITERACY.RI.4.2CCSS.ELA-LITERACY.RI.4.3CCSS.ELA-LITERACY.RI.4.4CCSS.ELA-LITERACY.RI.4.5
FREE
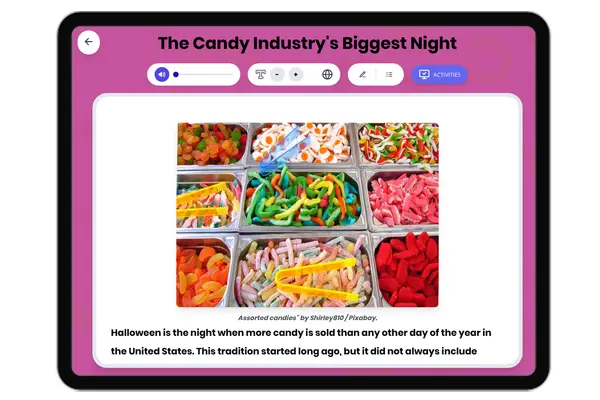
The Candy Industry's Biggest Night
RI.4.3RI.4.4RI.4.7W.4.2
$1.50
Samuel Slater Factory System
D2.HIS.2.3-5D2.HIS.3.3-5RI.4.3RI.4.4
$1.50
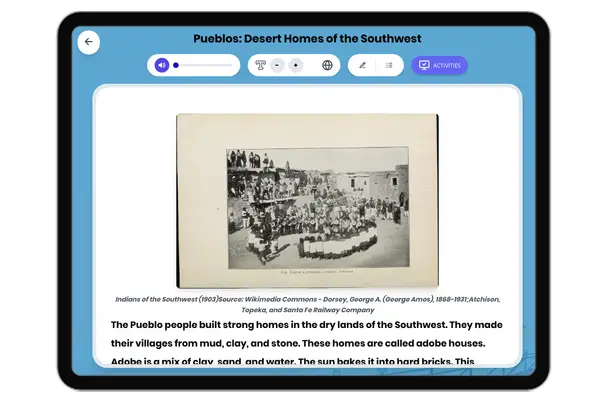
Pueblos: Desert Homes of the Southwest
D2.HIS.1-3.3-5RI.4.1RI.4.2RI.4.4
$1.50
Building Washington D.C., Our Capital
D2.HIS.1-3.3-5D2.HIS.14.3-5RI.4.3RI.4.4
FREE
Native Americans Lose Their Lands: The Trail of Tears
D2.HIS.1-4.3-5RI.4.3RI.4.4RI.4.7
FREE

Types of Barometers
3-5-ETS1-15-ESS2-1; RI.3.1RI.3.4RI.4.3
$1.50
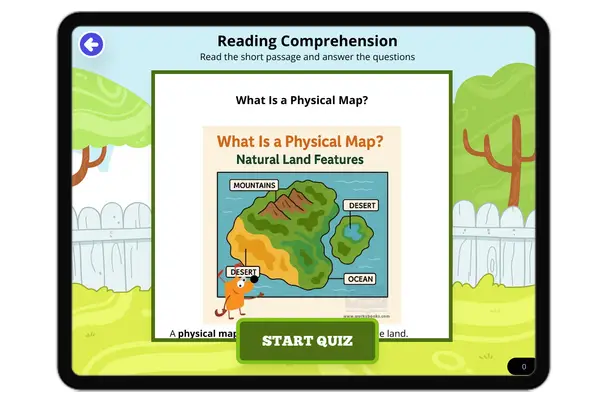
What Is a Physical Map?
5-ESS2-1RI.3.1RI.3.4RI.4.3
FREE

Desert Bighorn Sheep
RI.3.1RI.4.4RI.4.7
FREE

How Do Scientists Study Past Climates?
RI.4.1RI.4.2RI.4.3.4.RI.4.74-ESS2-2
FREE

Interpret Visuals - Weather Patterns and Precipitation
RI.4.73-ESS2-13-ESS2-2
$1.50

Weather and Temperature
RI.4.73-ESS2-13-ESS2-2
$1.50

Structure of a healthy tooth
RI.4.7
FREE

Structures on the Ocean Floor
ESS2.B4-ESS2-2RI.4.10RI.4.7
FREE
Get more from Workybooks
Three ways to use Workybooks — pick what fits.
Start free
$0
No credit card required
- Access to limited resources
- 1 download & 1 Quick Play per day
- 30-day assignment history
Pay as you go
From $1.50
Per resource, one-time
- Download and keep forever
- Online access while account is active
- No subscription, no auto-renew
Open any resource and click Buy.
Best value
Unlock everything
$49.99$29.99 / year
Summer sale • 40% off until Aug 1
All 6,000+ resources, unlimited use
- Download any worksheet, reader or printable
- Play every game and assign to classrooms
- Cancel anytime, no ads
Cancel anytime · No ads · Trusted by 30,000+ teachers