
Random Variable - Definition, Examples, Quiz, FAQ, Trivia
Learn about probability, outcomes, and how we measure uncertainty in math
What is a Random Variable?
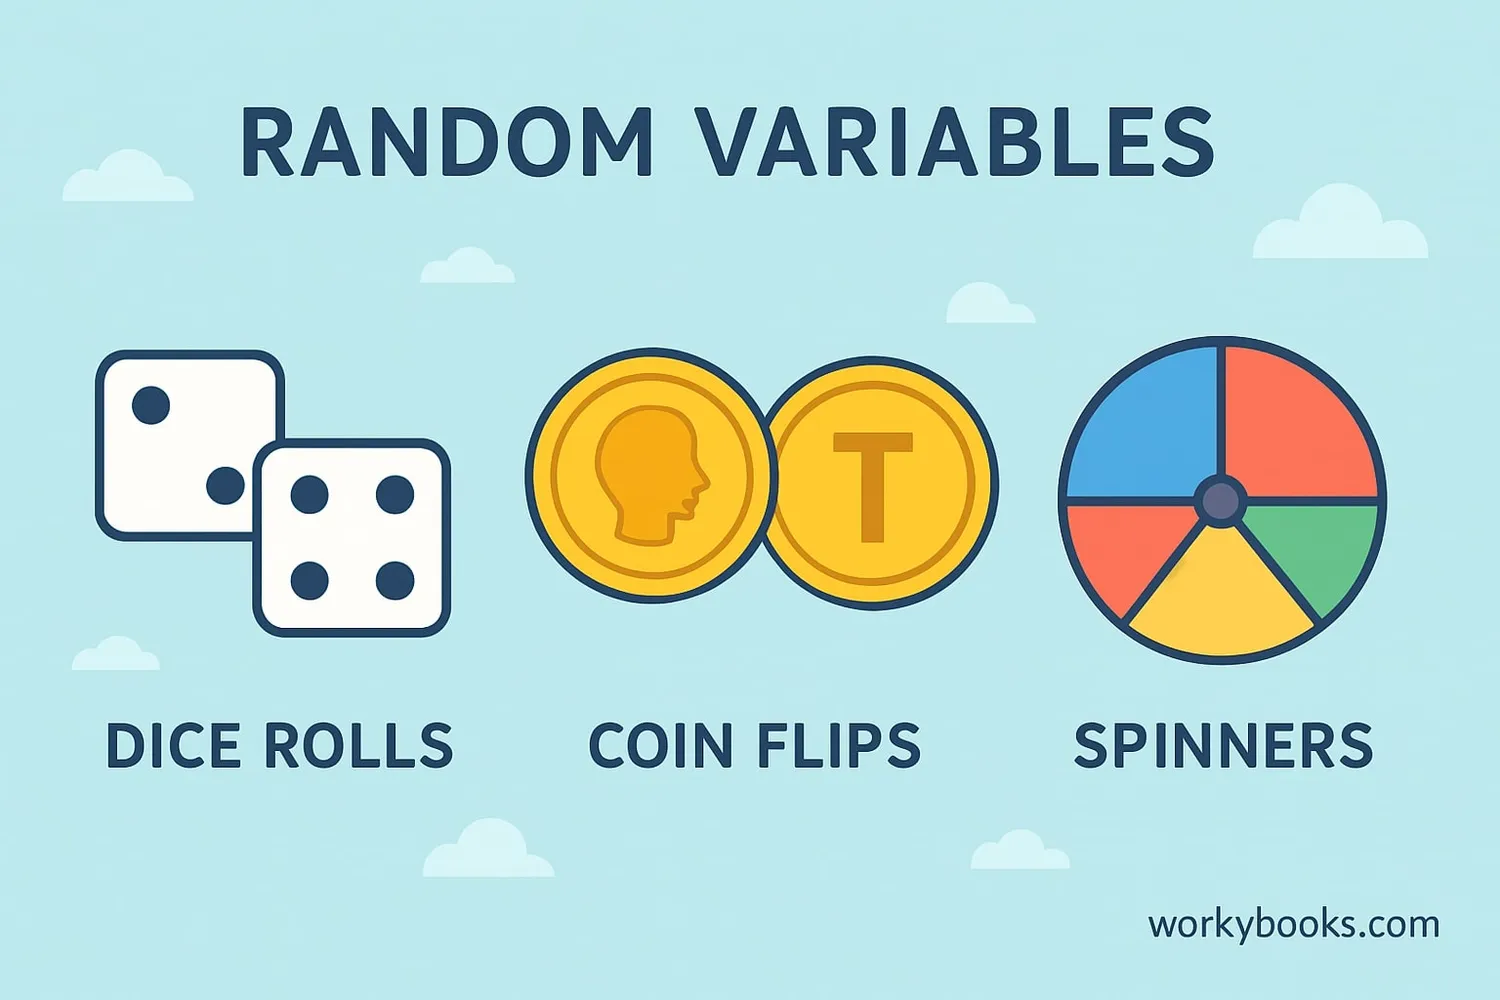
A random variable is like a special container that holds different possible outcomes from a random experiment. Think of it as a box that collects all the possible results we might get when we do something with an uncertain outcome.
For example, when you roll a die, the random variable could be the number that appears on top. The possible values are 1, 2, 3, 4, 5, or 6. Each of these outcomes has a specific probability (1/6 for a fair die).
Random variables help us:
- Organize all possible outcomes
- Assign probabilities to each outcome
- Calculate averages and other important values
Key Concept
A random variable is a numerical description of the outcome of a random experiment.
Types of Random Variables

There are two main types of random variables:
1. Discrete Random Variables: These can only take specific, separate values. Think of counting whole numbers:
- Number of heads when flipping 3 coins (0, 1, 2, or 3)
- Number of students in a classroom
- Roll of a die (1-6)
- Height of a person
- Temperature outside
- Time it takes to run a race
Remember
Discrete = countable outcomes (like whole numbers), Continuous = measurable outcomes (like decimals).
Probability Distribution
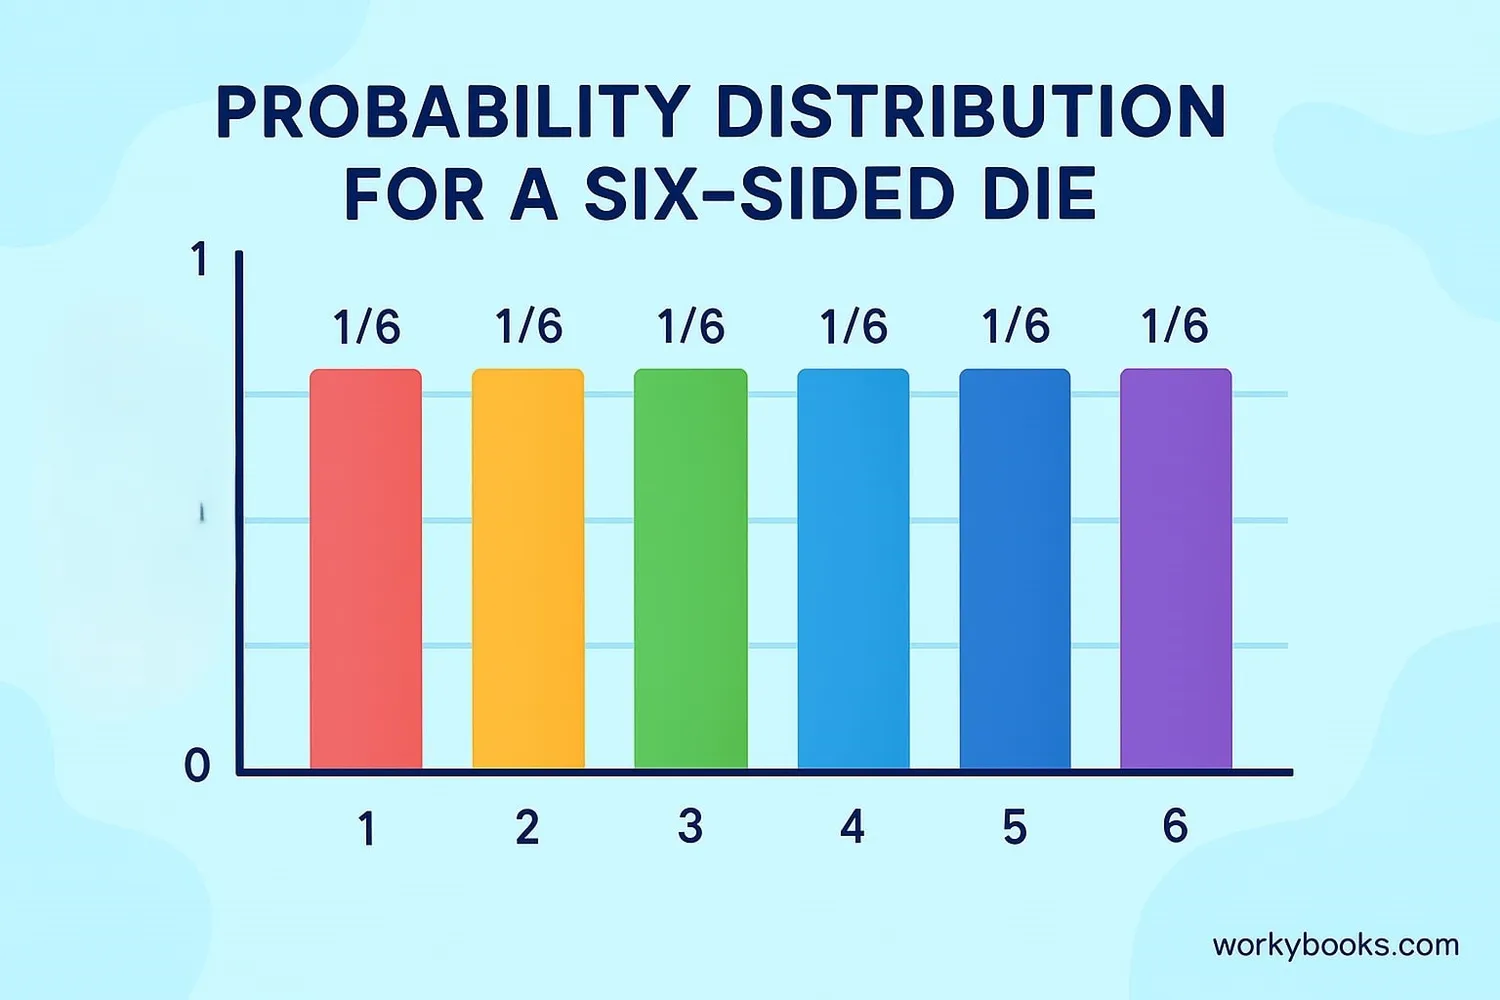
A probability distribution is like a menu that shows all possible outcomes and their probabilities. It tells us how likely each result is to happen.
For a discrete random variable, we can list all possible values and their probabilities. The sum of all probabilities must equal 1.
Example: Rolling a fair six-sided die
| Outcome (X) | 1 | 2 | 3 | 4 | 5 | 6 |
|---|---|---|---|---|---|---|
| Probability P(X) | 1/6 | 1/6 | 1/6 | 1/6 | 1/6 | 1/6 |
For continuous random variables, we use a different kind of distribution called a probability density function, which looks like a smooth curve.
Important Rule
The sum of all probabilities in a distribution must equal 1 (or 100%).
Mean and Variance
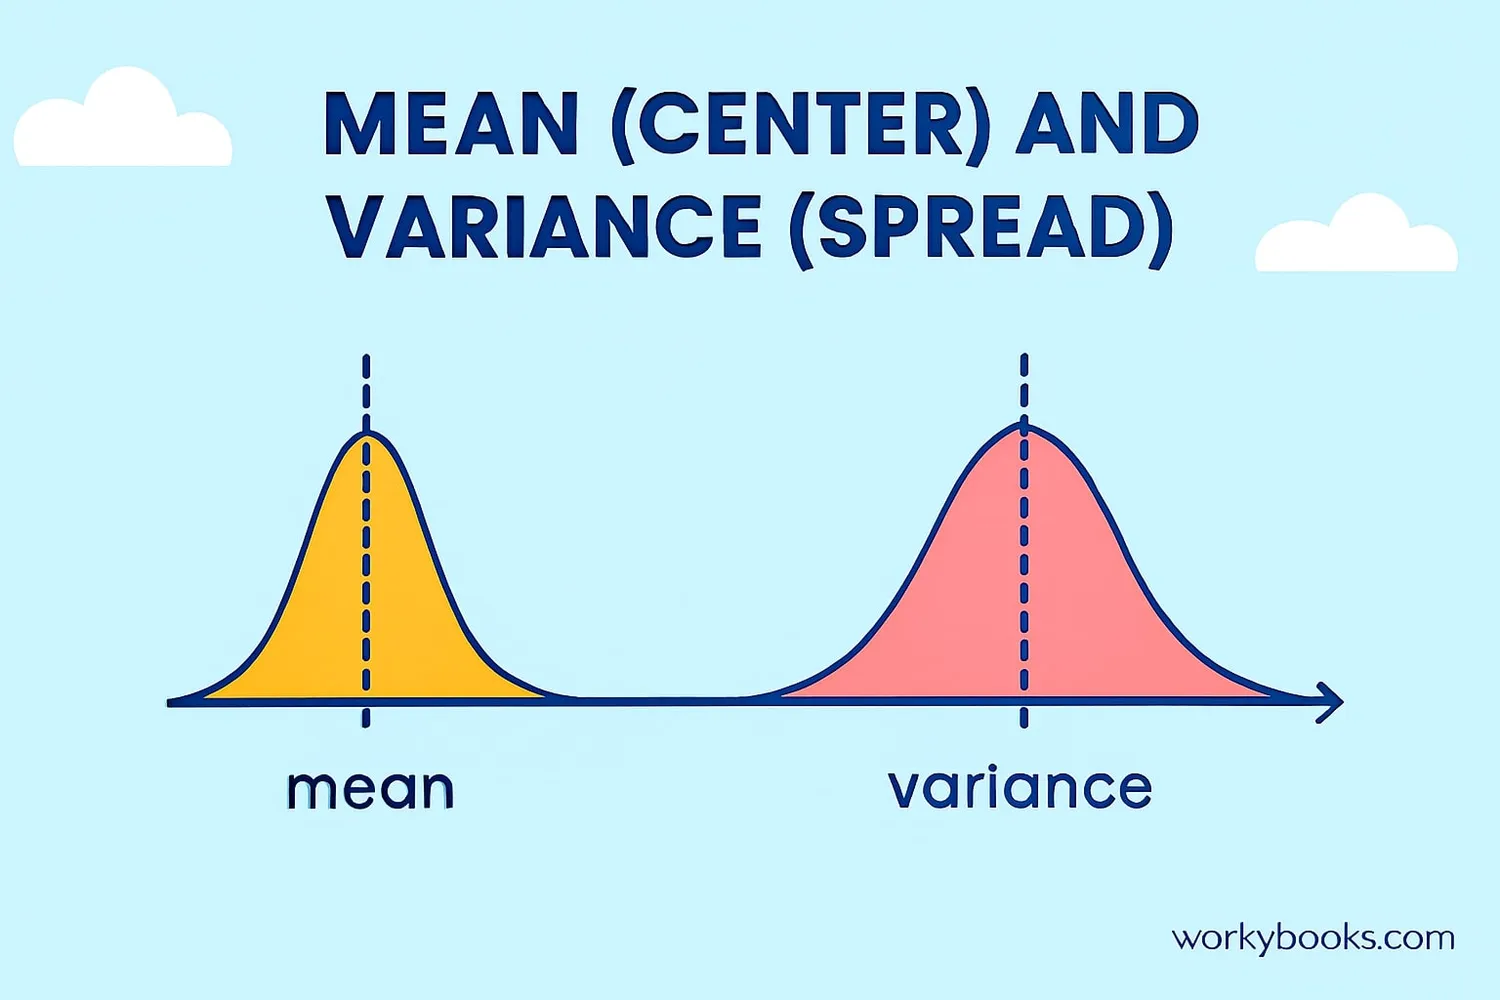
Mean (Expected Value): This is the long-run average value of the random variable. It tells us what to expect on average if we repeat the experiment many times.
Formula for discrete random variable:
Where x is the outcome and P(x) is its probability
Formula for variance:
Think of It Like This
Mean tells us the center of the distribution, variance tells us how spread out it is.
Examples
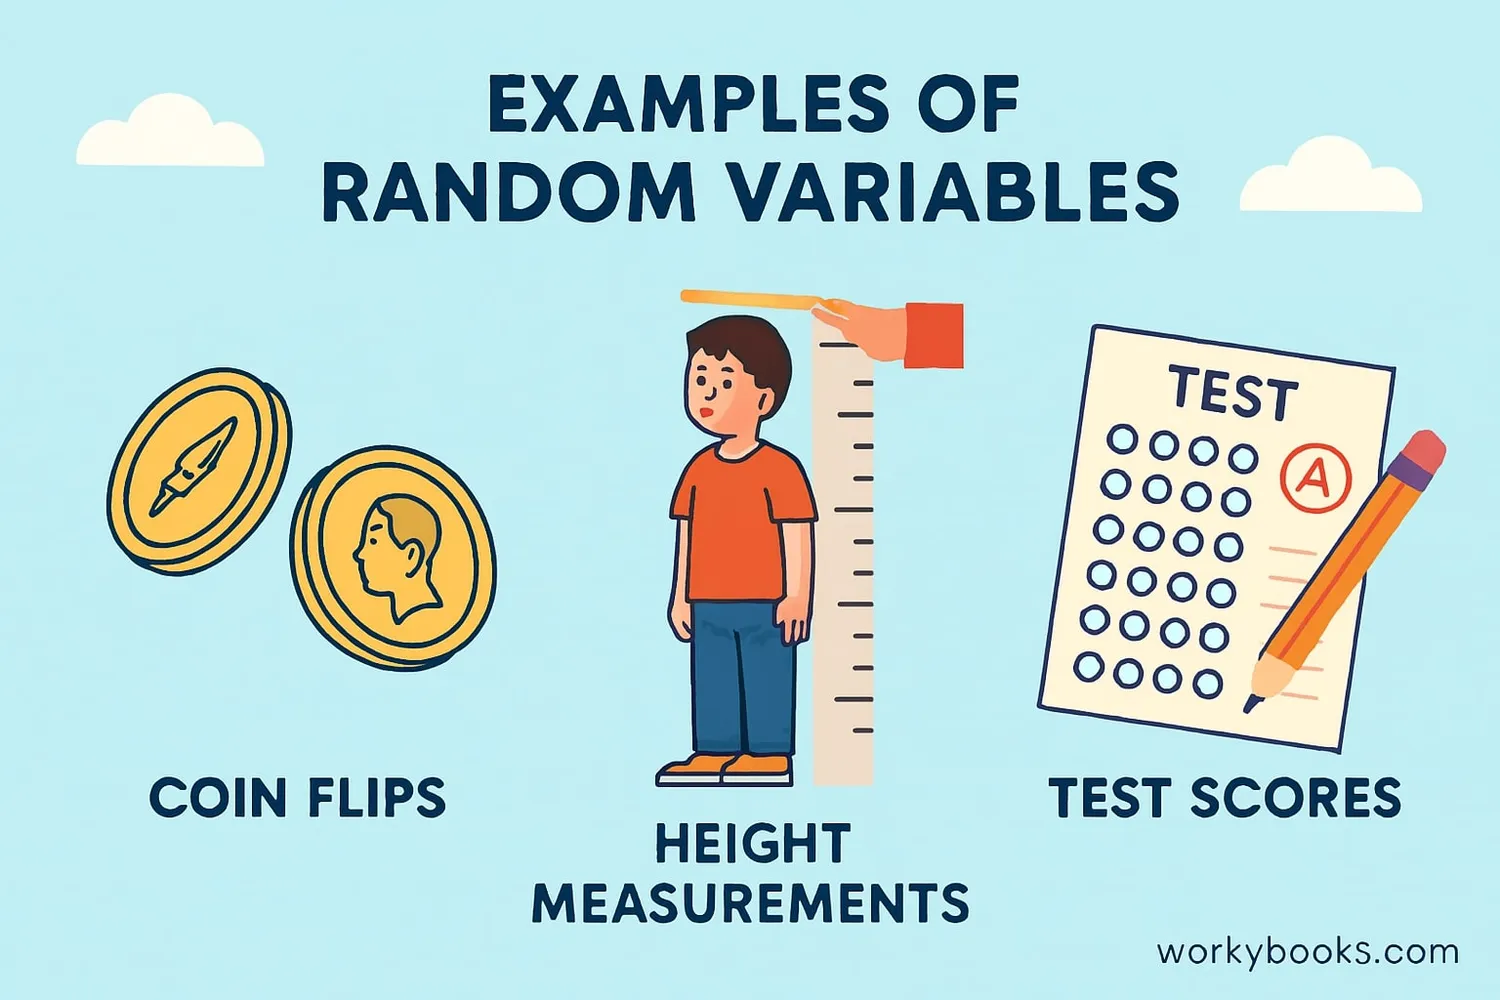
Example 1: Coin Flips
When flipping two coins, let X = number of heads.
Possible values: 0, 1, 2
Probability distribution:
- P(0) = P(two tails) = 1/4
- P(1) = P(one head, one tail) = 1/2
- P(2) = P(two heads) = 1/4
In a class test, scores follow a distribution:
- 90% of students score between 70-100
- 10% score below 70
The height of students in a class is a continuous random variable. We might find that:
- Most students are around 140-160 cm tall
- Few are below 130 cm or above 170 cm
Real-World Application
Random variables help us understand and predict outcomes in weather forecasting, games, and scientific experiments.
Practice Quiz
Test your understanding of random variables with this 5-question quiz. Choose the correct answer for each question.
Frequently Asked Questions
Here are answers to common questions about random variables:
Probability Trivia
Discover interesting facts about probability and random variables:
Origins of Probability
The mathematical study of probability began in the 17th century when French mathematicians Blaise Pascal and Pierre de Fermat exchanged letters about games of chance.
Probability in Nature
Genetic inheritance follows probability rules. When brown-eyed and blue-eyed parents have a child, there's a 75% probability the child will have brown eyes and 25% for blue eyes.
Quantum Randomness
At the quantum level, some events are truly random. For example, radioactive decay happens at random times that can only be described with probabilities.
Dice Probability
The probability of rolling doubles with two six-sided dice is 1/6. There are 36 possible outcomes when rolling two dice, and 6 of them are doubles.
