
Graphing Motion - Definition, Facts, Example, Quiz, Trivia
Discover how to represent movement visually through different types of graphs!
What is Motion?

Motion is when an object changes its position over time. Everything that moves - from a car driving down the road to a ball rolling on the ground - is in motion. Scientists use graphs to show motion because it helps us understand how objects move in a visual way.
When we graph motion, we put time on the horizontal (x) axis and either distance, velocity, or acceleration on the vertical (y) axis. This creates a picture of how something is moving!
Science Fact!
Even when you're sitting completely still, you're actually moving! The Earth is rotating at about 1,000 miles per hour and orbiting the sun at about 67,000 miles per hour!
Distance-Time Graphs
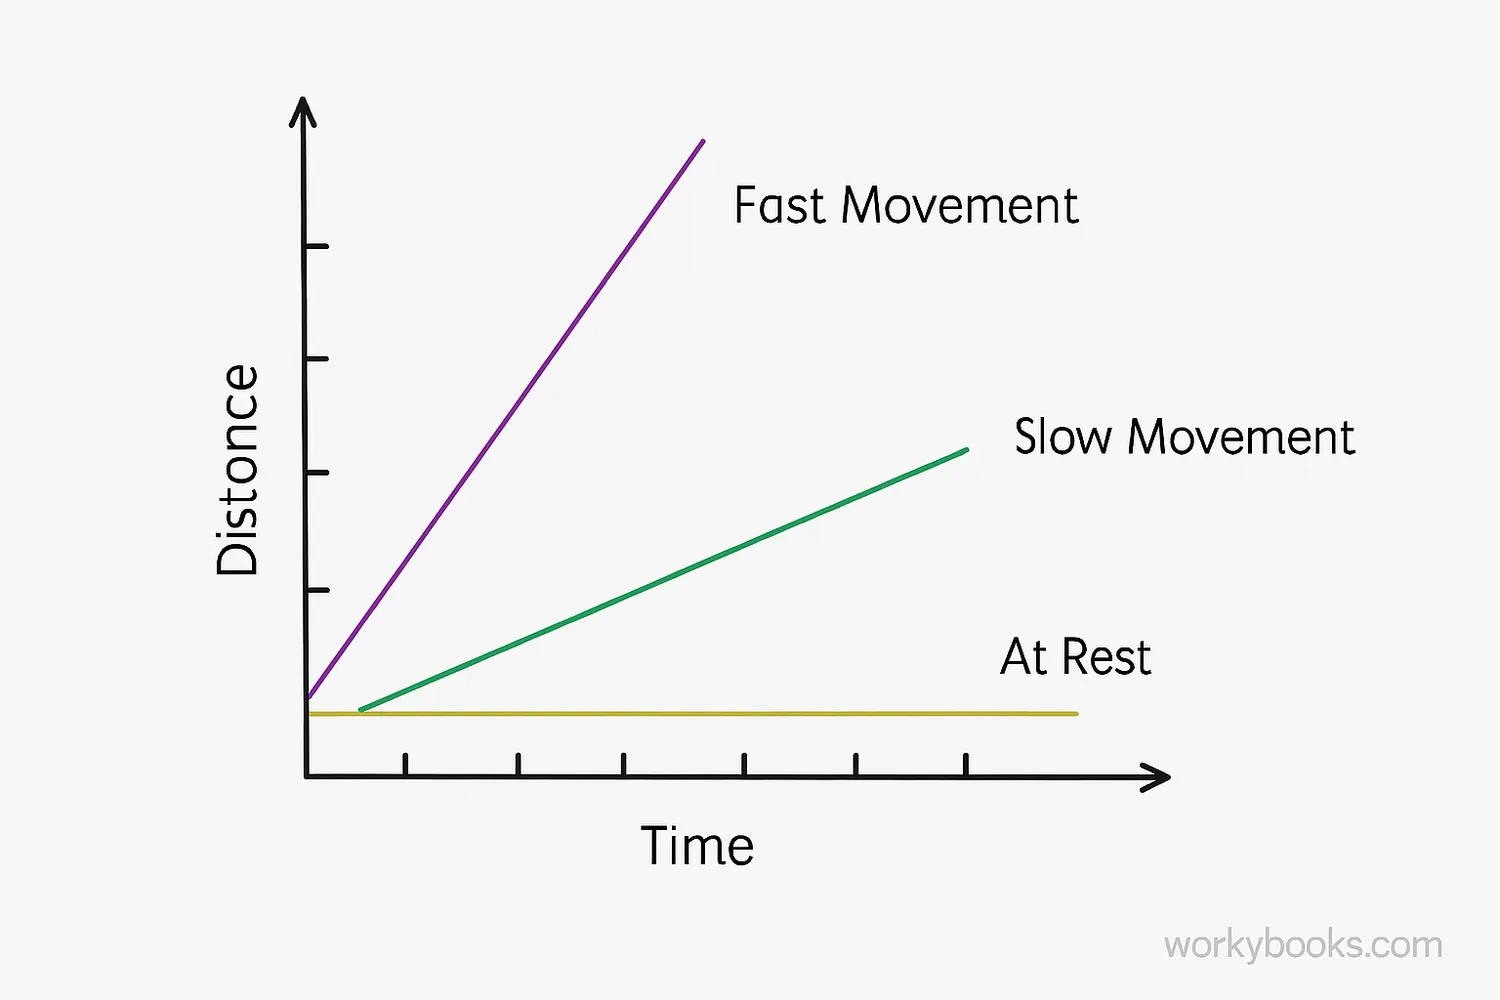
Distance-time graphs show how far an object has traveled over a period of time. On these graphs:
Steep Slope
Represents fast movement
Flat Line
Represents no movement (at rest)
Downward Slope
Represents moving back toward start
The slope of a distance-time graph tells us the speed of the object. A steeper slope means faster movement, while a gentler slope means slower movement. A horizontal line means the object isn't moving at all.
Constant Speed
Straight diagonal line on a distance-time graph
Example: Walking at a steady pace
Accelerating
Curved line that gets steeper over time
Example: Car speeding up
No Motion
Flat horizontal line
Example: Stopped at a red light
Velocity-Time Graphs
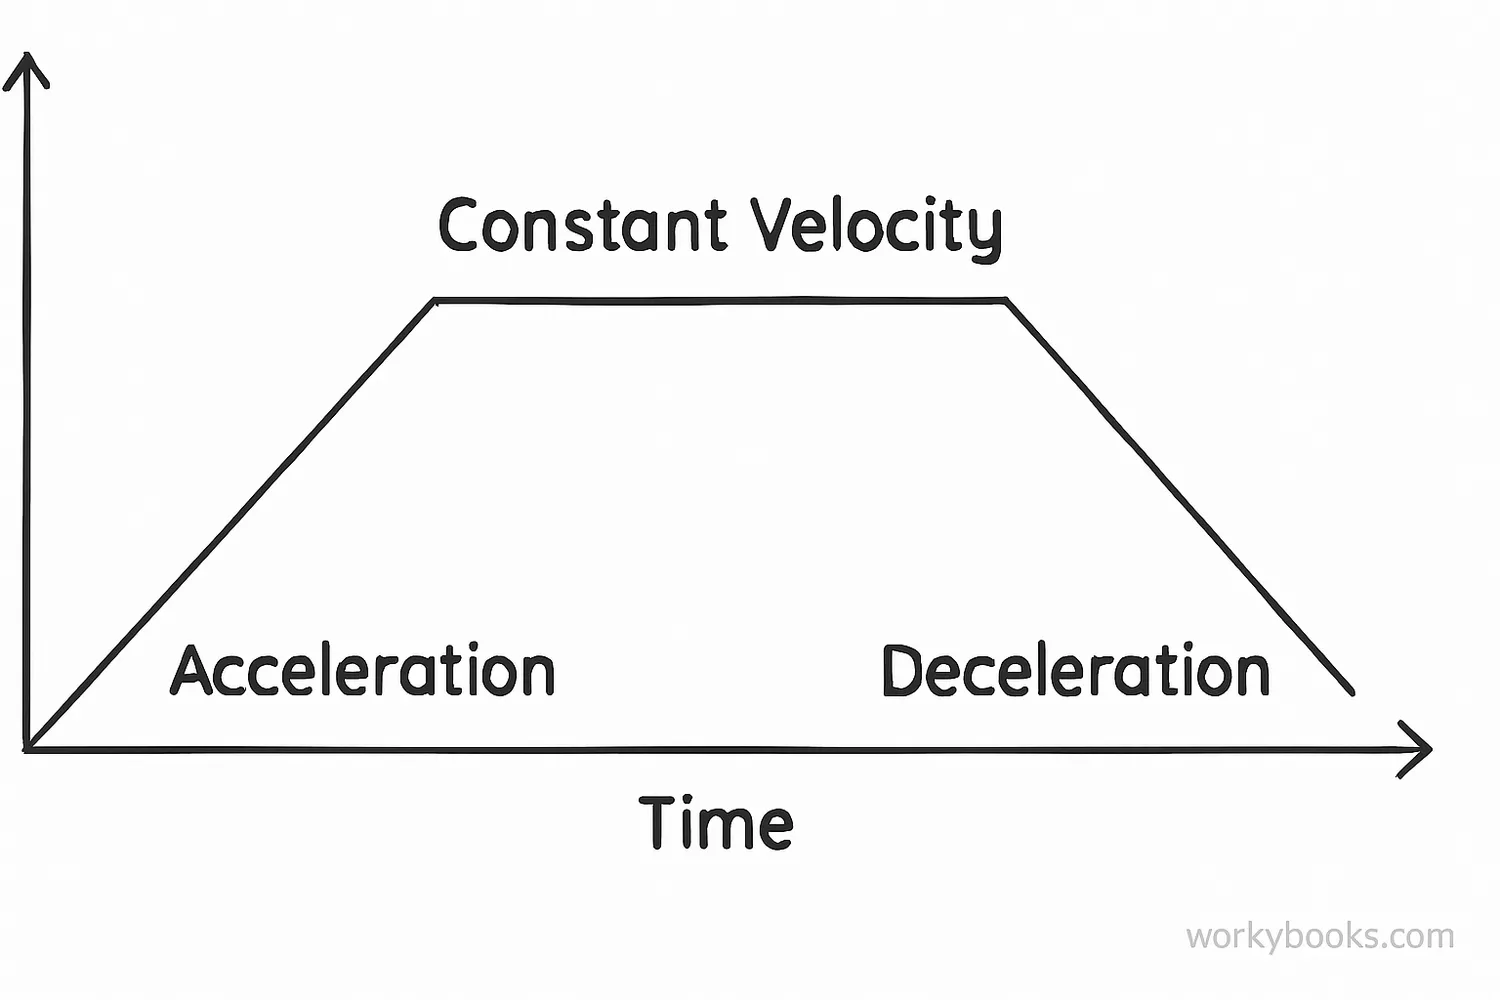
Velocity-time graphs show how an object's speed and direction change over time. Velocity is speed in a specific direction, so these graphs can show both how fast something is moving and whether it's moving forward or backward.
Positive Slope
Represents acceleration
Flat Line
Represents constant velocity
Negative Slope
Represents deceleration
On a velocity-time graph, the slope tells us about acceleration. A positive slope means the object is speeding up, a negative slope means it's slowing down, and a flat line means it's moving at a constant speed. The area under the line tells us the distance traveled.
Remember!
Velocity includes both speed and direction. An object moving at a constant speed but changing direction is accelerating!
Acceleration-Time Graphs
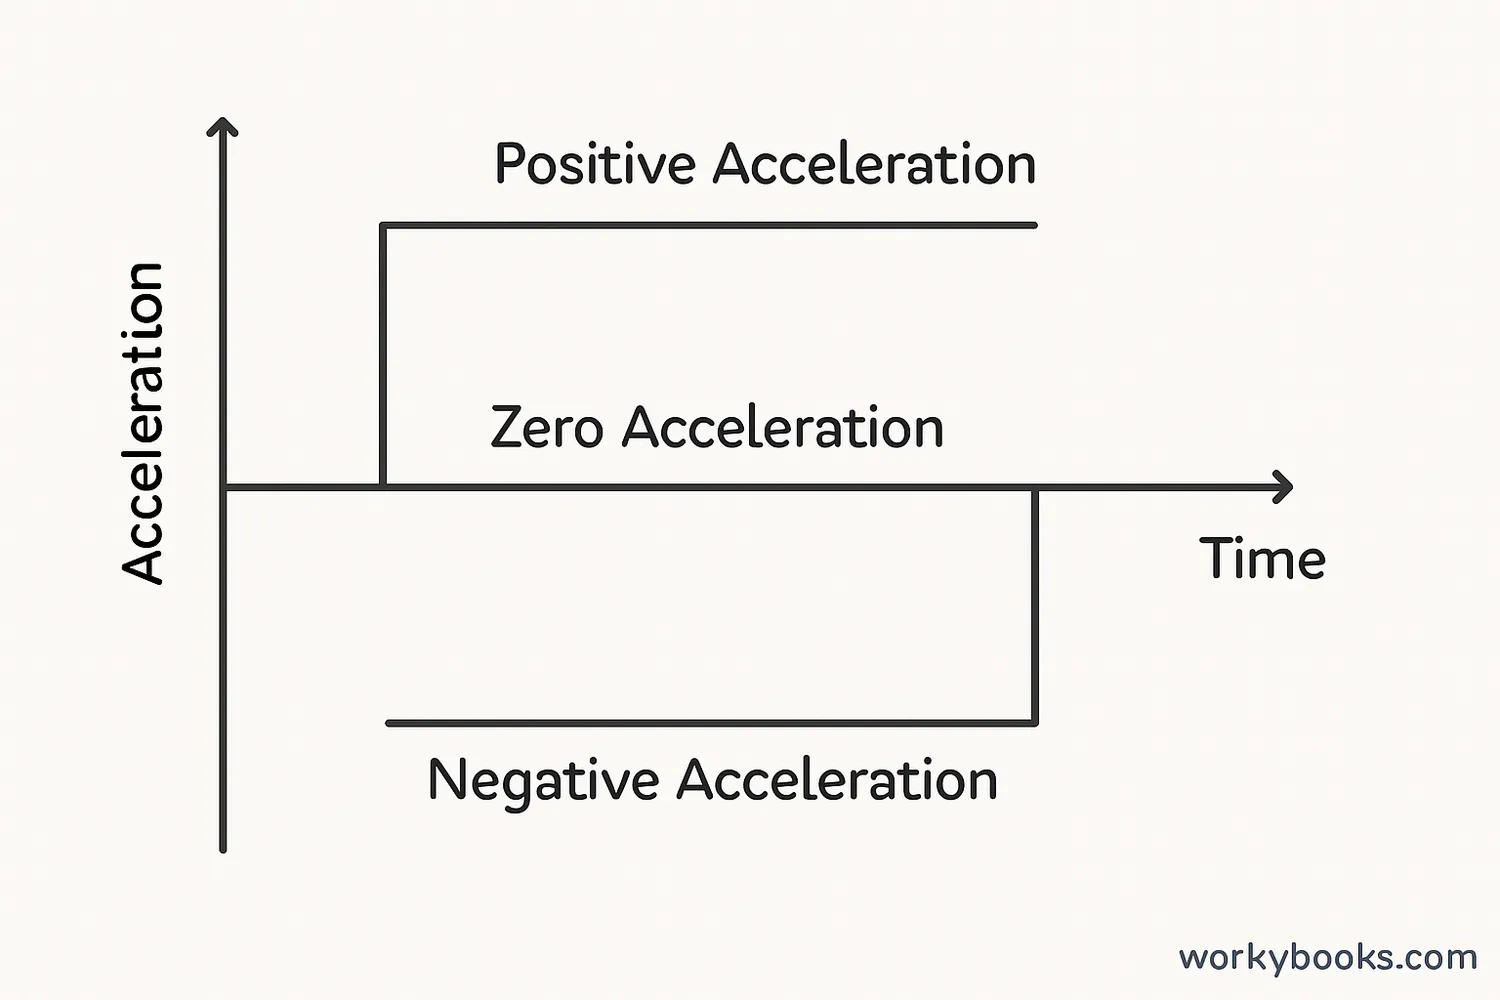
Acceleration-time graphs show how an object's acceleration changes over time. Acceleration is the rate at which velocity changes. These graphs help us understand how quickly something is speeding up or slowing down.
Above Zero
Positive acceleration (speeding up)
Below Zero
Negative acceleration (slowing down)
At Zero
No acceleration (constant velocity)
On an acceleration-time graph, a flat line above zero means constant acceleration (speeding up at a steady rate). A flat line below zero means constant deceleration (slowing down at a steady rate). A line at zero means no acceleration (moving at constant velocity).
Rocket Launch
Positive constant acceleration as rocket takes off
Flat line above zero on acceleration-time graph
Slamming Brakes
Negative constant acceleration when braking hard
Flat line below zero on acceleration-time graph
Cruise Control
Zero acceleration when maintaining constant speed
Flat line at zero on acceleration-time graph
Motion Graph Quiz
Test your knowledge of motion graphs with this quiz! Answer all 5 questions to see how much you've learned.
Frequently Asked Questions
Here are answers to some common questions about graphing motion:
Science Trivia
Discover some amazing facts about motion and graphing!
Father of Motion
Galileo Galilei is often called the "father of modern physics" because of his studies of motion. He was the first to demonstrate that all objects fall at the same rate regardless of mass (ignoring air resistance).
Speed Champions
The fastest land animal is the cheetah, which can accelerate from 0 to 60 mph in just 3 seconds! On a velocity-time graph, this would show an extremely steep positive slope.
Constant Motion
The International Space Station travels at about 17,500 mph! It orbits Earth every 90 minutes. On a distance-time graph, this would create a repeating wave pattern as it circles the planet.
Tiny Movements
Even atoms are in constant motion! They vibrate and move randomly. At room temperature, oxygen molecules travel at an average speed of about 1,000 mph before colliding with other molecules.
