Contour Lines and Elevation
Interactive passage with audio narration, comprehension questions, and printable PDF.
By completing this purchase you agree to our Terms of Use and Privacy Policy. Your subscription renews automatically until you cancel. You can cancel anytime from your account settings. All sales are final and non-refundable. Digital content is available for download in your account immediately upon purchase.
What's included
Contour Lines and Elevation preview and details
About this printable Contour Lines and Elevation science reading passage, NGSS-aligned (Grades 5-8)
Sample passage and quiz from Contour Lines and Elevation
Reading passage and comprehension quiz preview
Contour Lines and Elevation
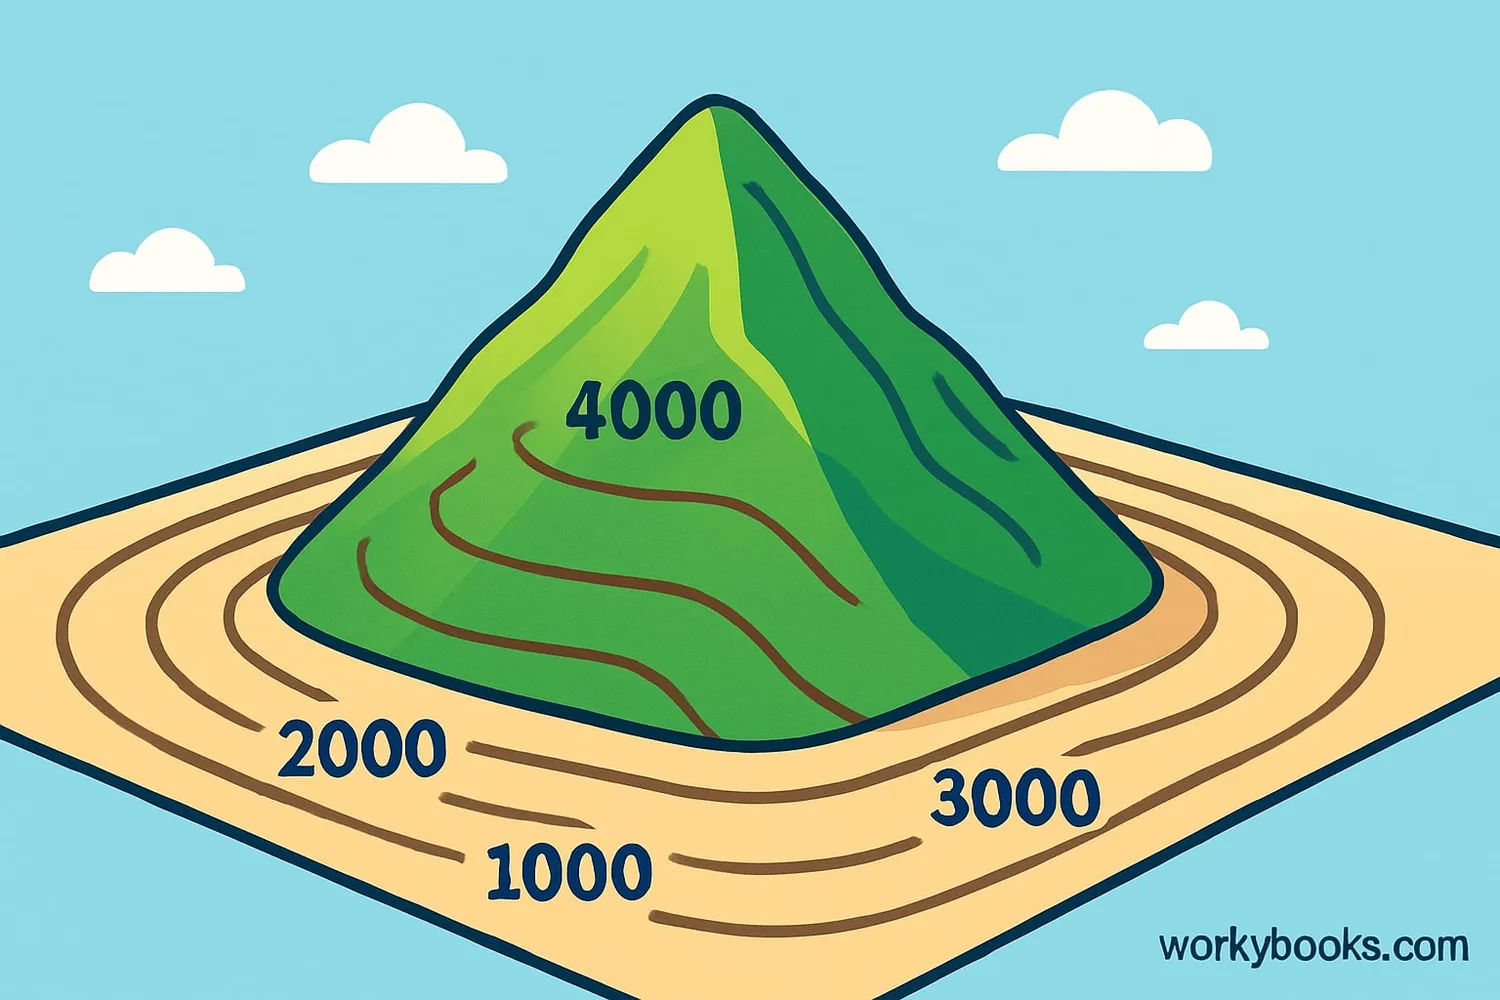
Topographic maps are essential tools for understanding the shape of Earth's surface. Scientists, hikers, and engineers use these maps to see how land rises and falls. The key feature of a topographic map is the contour line, which connects points that share the same elevation. By reading contour lines, we can answer important questions about landforms, slopes, and how water flows through landscapes.
How Contour Lines Work
Each contour line on a map connects all points at a specific elevation above sea level. The vertical distance between neighboring contour lines is called the contour interval. For example, if the contour interval is 20 meters, every line shows a change in elevation of 20 meters. Index contours are the thicker contour lines usually labeled with their exact elevation, often every fifth line, making it easier to quickly read the map. Contour lines never cross, because one place cannot be at two elevations at the same time. Where contour lines are close together, the land is steeper, such as on a cliff. Where they are farther apart, the land is flatter. In valleys, contour lines form V-shapes that point upstream, showing the direction water would flow. Depression contours have small marks, called hachures, pointing downslope to show areas that are lower than their surroundings, like craters or sinkholes.
Using Contour Lines to Analyze Landforms
Understanding contour lines allows us to identify specific landforms. Closed loops without hachures indicate hills or mountains, while closed loops with hachures show depressions. Long, narrow loops may indicate ridges or valleys. By counting the number of contour lines and using the contour interval, we can estimate the elevation of any point between the lines. To calculate the slope, we divide the change in elevation (rise) by the horizontal distance (run) between two points. This is critical for engineers designing roads, or for predicting how fast water will flow down a hill. Scientists also create profiles, which are cross-section diagrams showing what the land would look like if sliced along a line. These profiles help visualize the height and shape of landforms in a single view.
Broader Applications and Scientific Importance
Topographic maps and contour lines are not just for hiking or geography class. They are crucial in environmental science, helping experts predict flood zones or plan conservation efforts. Engineers rely on them to design safe transportation routes and buildings that fit the landscape. Emergency responders use topographic maps to plan evacuation routes during natural disasters. These maps also support scientific investigations of Earth's history, revealing patterns of erosion, volcanic activity, and plate tectonics. Understanding contour lines connects to broader scientific principles, such as systems thinking and analyzing patterns in nature.
In summary, contour lines provide a powerful way to interpret and analyze the physical features of Earth's surface. By mastering topographic maps, we gain tools to solve real-world problems and better understand the dynamic processes shaping our planet.
Interesting Fact:
Mount Everest's summit, the highest point on Earth, can be represented by a single, tiny closed contour line on a topographic map—showing the power of contour lines to model even the world's tallest peak!
Comprehension quiz (10 questions)
1. What is a contour line on a topographic map?
2. What does a contour interval tell you?
3. Which type of contour line is usually thicker and labeled with elevation?
4. What do V-shaped contour lines pointing upstream in a valley indicate?
5. What is the main purpose of a topographic map?
6. What does the word 'profile' mean in the context of topographic maps?
7. If contour lines on a map are very close together, what does this show about the land?
8. How do scientists use information from topographic maps in environmental science?
9. True or False: Contour lines can cross each other on a map.
10. True or False: Depression contours always have hachures pointing upslope.
Perfect for the way you teach
- Build comprehension skills
- Auto-graded quiz
- Differentiated reading
- Read together at home
- Improve fluency
- Quiet reading time
- Reading curriculum support
- Independent practice
- Track Lexile growth