Global Temperature Rise
Interactive passage with audio narration, comprehension questions, and printable PDF.
What's included
Global Temperature Rise preview and details
About this printable Global Temperature Rise science reading passage, NGSS-aligned (Grades 5-8)
Sample passage and quiz from Global Temperature Rise
Reading passage and comprehension quiz preview
Global Temperature Rise
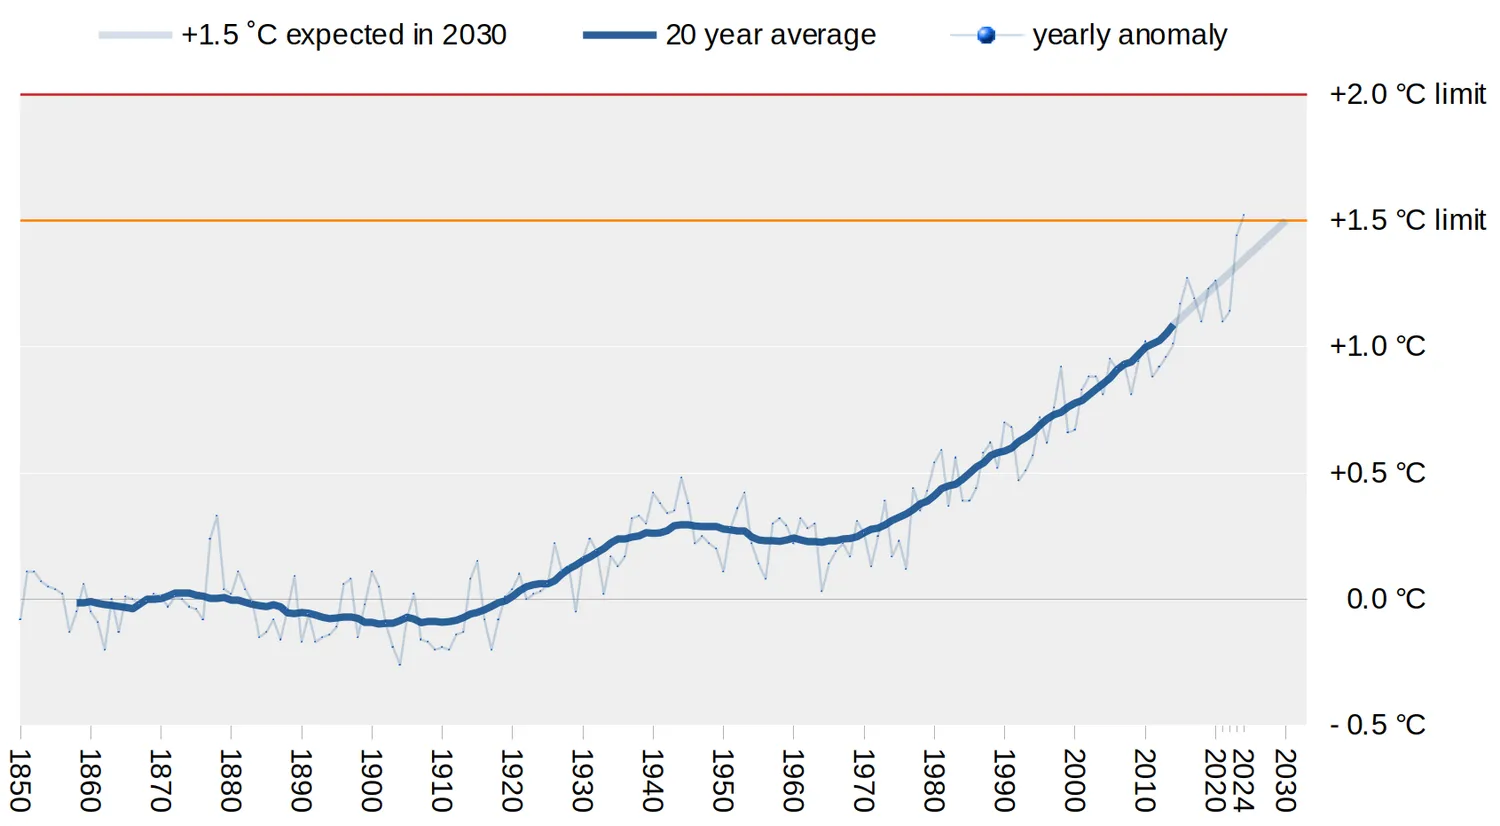
How much did global average temperature rise since the pre-industrial times?. Global temperature anomalies with 20 year average" by Uwappa / Wikimedia Commons
Earth's average temperature has climbed steadily over the past century. Scientists measure temperatures from weather stations, ships, and satellites around the world. These measurements show a clear pattern: our planet is getting warmer. The rise has sped up in recent decades, with most of the warming happening since 1980.
A one-degree rise in global average temperature might sound small at first. However, this change represents an enormous shift for the entire planet. Earth's climate system contains oceans, atmosphere, land, and ice. Moving the average temperature of all these systems requires huge amounts of trapped heat. Think of heating a swimming pool versus heating a cup of water. The larger the amount of water, the more energy you need to raise its temperature. Earth is much larger than any swimming pool, so shifting its average temperature takes tremendous energy.
Evidence shows that the warmest years on record have nearly all happened recently. Scientists analyze temperature records from thousands of locations worldwide. The data reveals an upward trend, not random variation. For example, 2016, 2019, and 2020 ranked among the hottest years since record-keeping began in the late 1800s. This pattern appears consistent across different measurement methods and locations.
The temperature rise affects Earth's systems in measurable ways. Glaciers and ice sheets melt faster than before. Sea levels rise as ocean water expands when heated. Weather patterns shift, changing where and when rain falls. Some regions experience more intense heat waves and droughts. These changes connect directly to the warming trend scientists observe.
Understanding global temperature rise matters because it affects ecosystems and human communities. Plants and animals adapted to specific temperature ranges may struggle as conditions change. Coastal cities face risks from rising seas. Farmers must adapt to shifting growing seasons. The global temperature trend provides central evidence for understanding Earth's changing climate. Scientists continue monitoring temperatures to track how quickly warming occurs and to predict future changes.
Interesting Fact: Earth's average temperature has risen about 1.1 degrees Celsius (2 degrees Fahrenheit) since 1880, with more than half of this warming occurring after 1975.
Comprehension quiz (10 questions)
1. What do scientists use to measure Earth's temperature?
2. Why is a one-degree rise in global average temperature considered significant?
3. In the passage, what does the word 'trend' mean?
4. What does the word 'evidence' mean in the context of this passage?
5. Based on the passage, what can you infer about why scientists use multiple methods to measure temperature?
6. How does the warming trend affect weather patterns according to the passage?
7. If you wanted to apply the concept from the passage, which situation would be most similar to Earth's temperature rise?
8. Why do coastal cities face particular risks from global temperature rise?
9. True or False: Most of the warming observed on Earth has occurred since 1980.
10. True or False: The warmest years on record are spread evenly throughout the past 150 years.
Perfect for the way you teach
- Build comprehension skills
- Auto-graded quiz
- Differentiated reading
- Read together at home
- Improve fluency
- Quiet reading time
- Reading curriculum support
- Independent practice
- Track Lexile growth