How Scientists Use Data to Make Decisions
Interactive passage with audio narration, comprehension questions, and printable PDF.
By completing this purchase you agree to our Terms of Use and Privacy Policy. Your subscription renews automatically until you cancel. You can cancel anytime from your account settings. All sales are final and non-refundable. Digital content is available for download in your account immediately upon purchase.
What's included
How Scientists Use Data to Make Decisions preview and details
About this printable How Scientists Use Data to Make Decisions science reading passage, NGSS-aligned (Grades 6-8)
Sample passage and quiz from How Scientists Use Data to Make Decisions
Reading passage and comprehension quiz preview
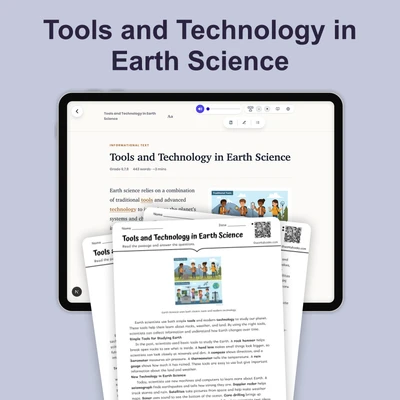
How Scientists Use Data to Make Decisions
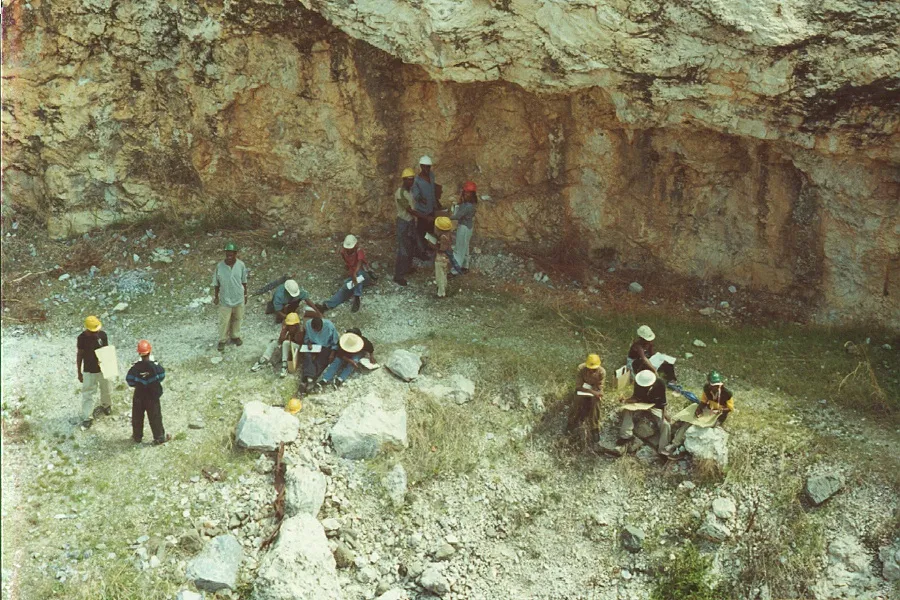
Geologists examine rock layers to understand Earth's history. .Uz geology fieldschool2002" by Babakathy / Wikimedia Commons
Scientists make decisions based on data, which is information collected through observation and measurement. Earth scientists gather data from many different sources to understand natural processes and make predictions. These sources include satellites orbiting Earth, sensors placed on land and in oceans, computer models that simulate natural systems, and direct field observations made by researchers. By combining data from multiple sources, scientists build a more complete and accurate picture of how Earth works.
Satellites provide a bird's-eye view of Earth's surface and atmosphere. They measure temperature, track weather patterns, monitor sea levels, and detect changes in land use. For example, satellites equipped with special cameras can detect heat signatures from wildfires or measure the thickness of ice sheets in polar regions. Remote sensing technology allows scientists to collect data from places that are difficult or dangerous to reach directly. This technology sends signals to Earth's surface and measures what bounces back, revealing information about terrain, vegetation, and water resources.
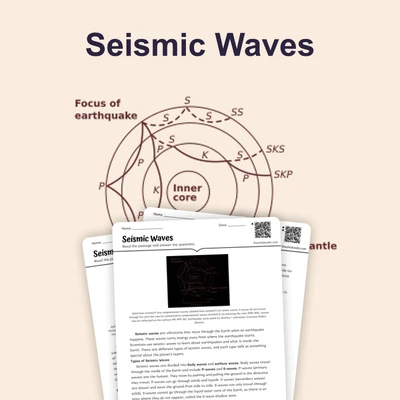
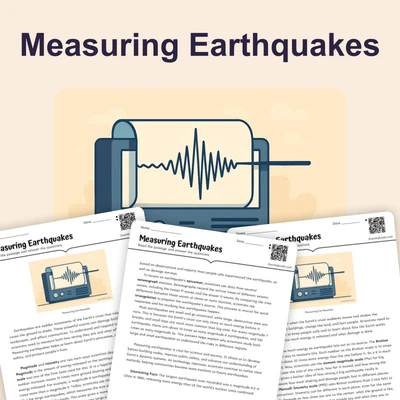
Ground-based sensors and instruments provide detailed local data that satellites cannot capture. Seismometers detect earthquake vibrations and help scientists understand fault lines and predict future seismic activity. Weather stations with instruments called anemometers measure wind speed, while rain gauges track precipitation. Ocean buoys collect data about water temperature, wave height, and currents. Scientists place these sensors in strategic locations to monitor specific conditions over time, creating long-term data sets that reveal patterns and trends.
Computer models are mathematical representations of natural systems that help scientists make predictions. Scientists input real data into these models to simulate how systems might behave under different conditions. Climate models, for instance, use data about atmospheric gases, ocean temperatures, and solar radiation to predict future climate patterns. Hurricane models combine satellite data, ocean temperature readings, and atmospheric pressure measurements to forecast a storm's path and intensity. These models are constantly tested and improved as scientists gather more data and refine their understanding.
Field observations involve scientists directly examining and measuring natural phenomena. Volcanologists climb active volcanoes to collect gas samples and measure ground deformation. Marine biologists dive to observe coral reef health. Geologists examine rock layers to understand Earth's history. These hands-on observations provide context and detail that other data sources might miss. Scientists use standardized methods and tools to ensure their observations are accurate and can be verified by other researchers. This process of peer review helps ensure scientific findings are reliable.
Once scientists collect data from various sources, they must analyze and interpret it to draw conclusions. Data analysis involves looking for patterns, calculating averages, and identifying relationships between different variables. Scientists use graphs, charts, and statistical methods to organize and visualize their data. They compare new data with historical records to identify changes over time. When multiple data sources point to the same conclusion, scientists have stronger evidence to support their explanations. This evidence-based approach helps scientists make informed decisions about managing natural resources, preparing for natural hazards, and developing environmental policies.
The decisions scientists make based on data have real-world impacts. Data about earthquake risks helps engineers design safer buildings in seismically active areas. Information about groundwater levels guides decisions about water usage during droughts. Air quality data influences policies to reduce pollution. By collecting, analyzing, and interpreting data from multiple sources, scientists provide the evidence needed to protect communities and manage Earth's resources responsibly. This systematic approach to understanding nature is what makes science a powerful tool for solving problems and making decisions that affect everyone.
Interesting Fact: The National Oceanic and Atmospheric Administration (NOAA) operates a network of over 1,000 weather stations across the United States that collect data every hour, generating more than 8 million observations each day to help predict weather patterns and track climate change.
Comprehension quiz (10 questions)
1. What is data in science?
2. Which of the following is NOT mentioned as a source of data that Earth scientists use?
3. What does remote sensing technology do?
4. What is the purpose of a seismometer?
5. Based on the passage, what is a climate model?
6. Why do scientists use multiple sources of data instead of just one?
7. What does peer review help ensure in scientific research?
8. How do scientists use data analysis to draw conclusions?
9. Satellites can measure the thickness of ice sheets in polar regions.
10. According to the passage, computer models never need to be improved or updated.
Perfect for the way you teach
- Build comprehension skills
- Auto-graded quiz
- Differentiated reading
- Read together at home
- Improve fluency
- Quiet reading time
- Reading curriculum support
- Independent practice
- Track Lexile growth