This learning resource is available in interactive and printable formats. The interactive worksheet can be played online and assigned to students. The Printable PDF version can be downloaded and printed for completion by hand.
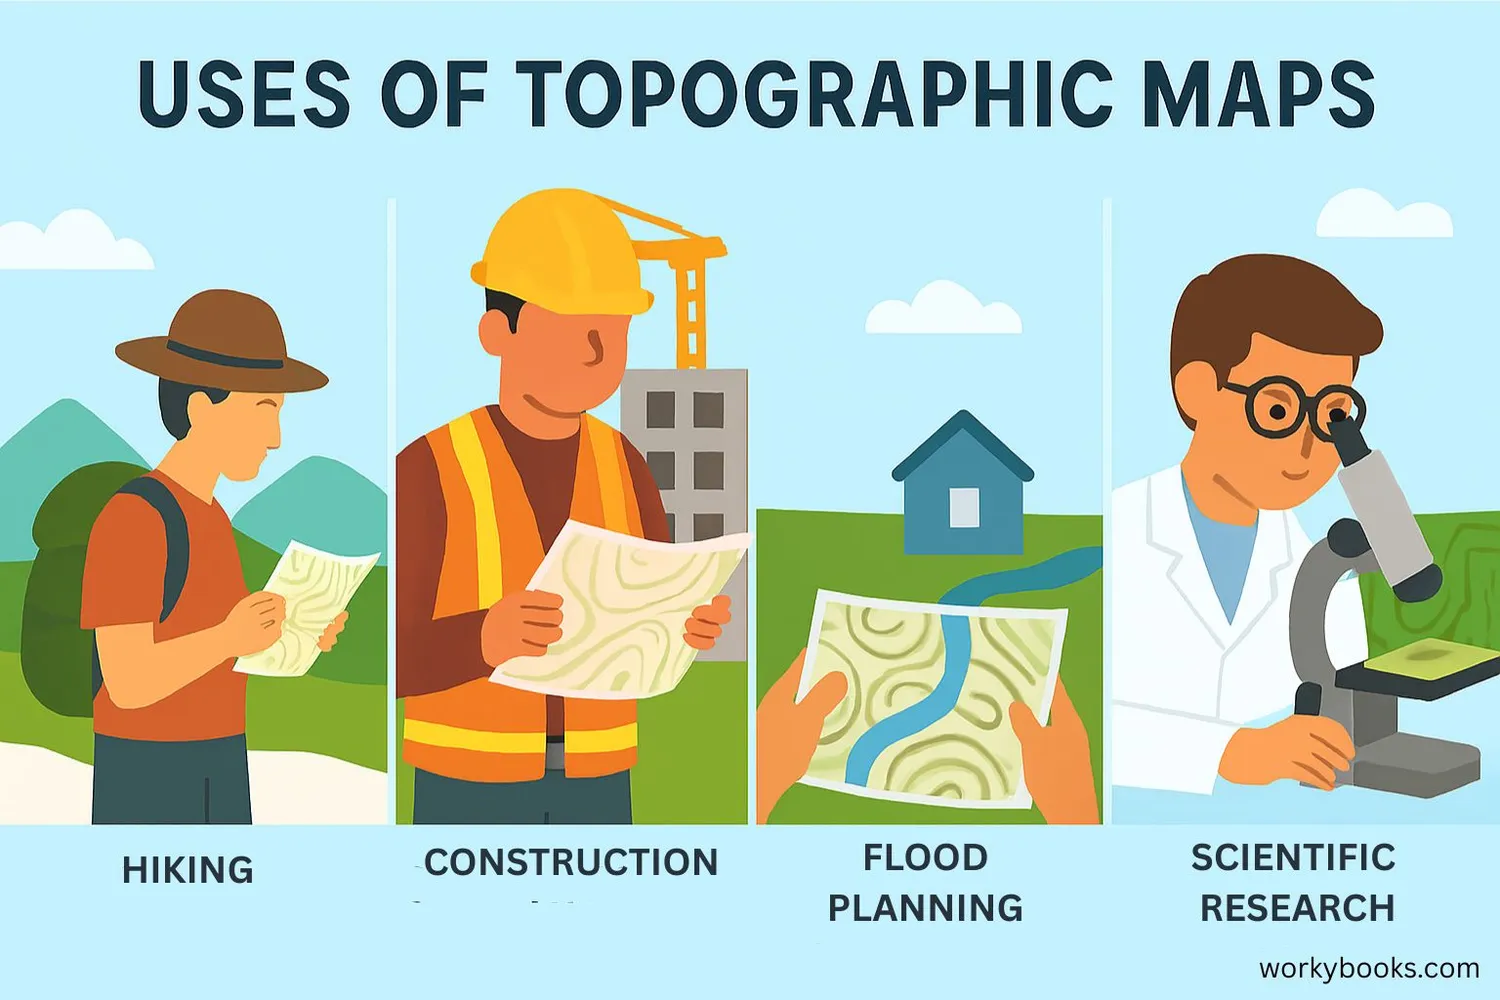
This engaging science passage for grades 6-8 introduces students to the various types of maps and their uses, supporting NGSS standards for scientific practices and earth science concepts. Students will learn to distinguish between political, physical, topographic, geologic, bathymetric, weather, climate, hazard, land use, and soil maps. The passage explains underlying mechanisms, such as how map projections influence what we see and how choosing the right map depends on scientific questions. Real-world examples connect map types to environmental studies, urban planning, and disaster preparedness. Integrated glossary terms, Spanish translations, a comprehension quiz, writing prompts, and graphic organizers reinforce key vocabulary and concepts. This resource is ideal for classroom, remote, or audio-integrated science learning and supports students in developing spatial reasoning and analysis skills crucial for scientific inquiry.
CONTENT PREVIEW
Expand content preview
Various uses of topographic maps in different fields
Maps serve as essential tools for representing features of Earth and helping people analyze information about the planet. Scientists, geographers, and everyday people rely on different types of maps to answer questions about the world’s systems and patterns. Understanding how and why different maps are used is crucial for making decisions about the environment, society, and technology.
Specialized Maps: Purposes and Mechanisms
Each type of map is designed to display certain kinds of data. Political maps show boundaries, cities, and countries, helping people understand human organization and relationships. Physical maps focus on landforms like mountains, rivers, and deserts, often using shading and colors to represent elevation. Topographic maps provide detailed information about elevation using contour lines, which connect points of equal height. Geologic maps display rock types, ages, and structures, revealing how Earth's surface has changed over time. Bathymetric maps show the shape of the ocean floor, using depth contours similar to topographic maps. Each map’s design reflects its purpose—using symbols, colors, and scales to communicate specific information clearly.
Interacting Systems and Real-World Applications
Other specialized maps help us analyze dynamic Earth systems. Weather maps show atmospheric conditions such as temperature, air pressure, and fronts, helping meteorologists predict storms. Climate maps reveal long-term patterns, such as average rainfall or temperature, supporting research about climate change. Hazard maps identify zones at risk for earthquakes, floods, or volcanoes, which is essential for public safety and urban planning. Land use maps show how land is utilized—whether for farming, forests, or cities. Soil maps provide information about soil types and properties, critical for agriculture and construction. Scientists often use several map types together to analyze complex problems, such as how soil and climate affect farming or how elevation and geology relate to earthquake risk.
Map Projections, Digital Maps, and Choosing the Right Tool
Because Earth is a sphere, any flat map involves a map projection. Projections flatten the surface but always create some distortion—changing the true area, shape, distance, or direction. For example, the Mercator projection preserves direction but distorts size near the poles, while the Robinson projection tries to balance shape and area errors. Today, digital maps allow users to interact with many layers of information, customize views, and analyze data in real time. Scientists select map types and projections based on their research questions and the features they need to observe. The ability to interpret and choose among maps is fundamental for investigating Earth’s systems and making informed decisions about the environment.
Maps are more than just pictures—they are scientific models that help us see patterns, make predictions, and solve problems. As our technology improves, maps become even more powerful tools for understanding the complex systems that shape our world.
Interesting Fact: Most of the ocean floor was mapped in more detail by satellites in the last 50 years than in all earlier human history combined!
Which type of map uses contour lines to show elevation?
Topographic mapPolitical mapWeather mapLand use map
What feature do political maps show that physical maps do not?
MountainsRiversCountry boundariesElevation
Which map would a meteorologist use to track a thunderstorm?
Geologic mapWeather mapSoil mapBathymetric map
What does the term 'map projection' describe in the passage?
A way to show the round Earth on a flat surfaceA map showing future weatherA map that uses only contour linesA map designed for city planning
What is the primary use of a bathymetric map?
Showing the ocean floor's shape and depthShowing city boundariesShowing climate patternsShowing soil properties
What is one reason scientists use more than one map type for a problem?
To save timeBecause maps are always inaccurateTo analyze complex problems involving many factorsTo create new countries
Which term best describes a boundary between air masses?
Contour lineMap projectionFrontSoil type
A digital map allows users to:
Interact with information and customize viewsShow only one type of dataWork only on paperDisplay only physical features
True or False: Physical maps use colors to show natural landforms.
TrueFalse
True or False: All maps show the Earth with no distortion.
TrueFalse
Perfect For:
👩🏫 Teachers
• Reading comprehension practice
• Auto-graded assessments
• Literacy skill development
👨👩👧👦 Parents
• Reading practice at home
• Comprehension improvement
• Educational reading time
🏠 Homeschoolers
• Reading curriculum support
• Independent reading practice
• Progress monitoring
Reading Features:
📖
Reading Passage
Engaging fiction or nonfiction text
❓
Comprehension Quiz
Auto-graded questions
📊
Instant Feedback
Immediate results and scoring
📄
Printable Version
Download for offline reading
🔊
Read Aloud
Voice-over with word highlighting
Reviews & Ratings
No reviews yet. Be the first to share your experience!
Related Content
Frost Wedging: How Ice Splits Rock
This passage explains frost wedging as a mechanical weathering process. Aligned with NGSS MS-ESS2-1 (Earth’s systems) a...
MS-ESS2-1MS-ESS2-2RST.6-8.3
Volcanic Eruptions: Causes, Types, and Key Features
This science passage explains volcanic eruptions, aligned with NGSS MS-ESS3-2 (natural hazards) and ESS2-2 (Earth’s syst...
MS-ESS3-2MS-ESS2-2RST.6-8.3
Chemical Weathering: The Breakdown of Rocks Through Chemical Reactions
This passage explains chemical weathering processes, aligned with NGSS MS-ESS2-1 (Earth’s systems) and ESS2-2 (surface ...
MS-ESS2-1MS-ESS2-2RST.6-8.4
Talus Slopes: Formation and Features
This earth science passage explains talus slope formation through mechanical weathering processes, aligning with NGSS MS...