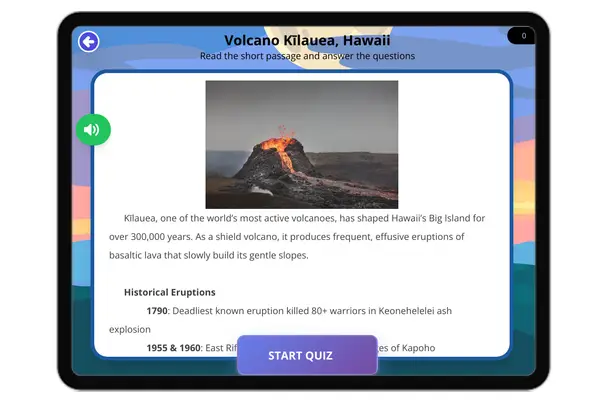
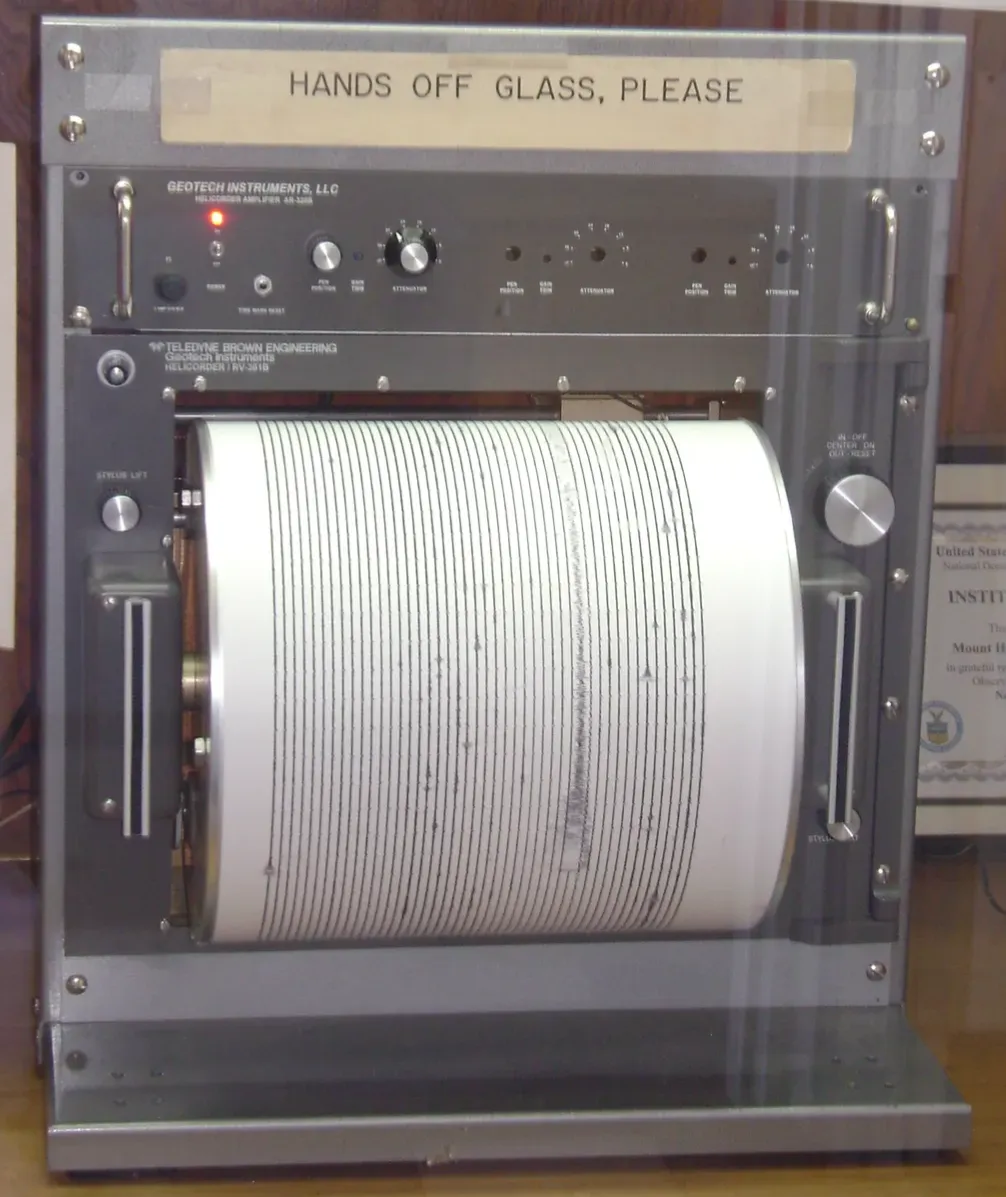
This comprehensive 650-word reading passage explains how seismographs detect earthquakes for middle school students in grades 6-8. Students learn how seismographs measure ground motion caused by seismic waves, how networks of seismographs allow scientists to locate earthquake epicenters, determine magnitude, and map fault activity. The passage connects seismic monitoring to earthquake hazard assessment and early warning systems. Aligned with NGSS science standard MS-ESS3-2, this audio-integrated resource includes a simplified differentiated version for struggling readers and English Language Learners, Spanish translations, glossary of key terms, multiple-choice questions, writing activities, and graphic organizers. Students explore real-world applications of seismograph technology in protecting communities from earthquake hazards. The passage uses clear, grade-appropriate language with scientific terminology defined in context, making complex earth science concepts accessible to all learners.
Written by Workybooks TeamPublished by Workybooks
Preview
Sample passage and quiz content
CONTENT PREVIEW
Expand content preview
Seismometer at Lick Observatory by Oleg Alexandrov / Wikimedia Commons
A seismograph is an instrument that detects and records ground motion caused by earthquakes. When an earthquake occurs, it releases energy in the form of seismic waves that travel through Earth's layers and across its surface. Seismographs contain a suspended weight that remains nearly still while the ground and instrument shake around it. As the Earth moves, a pen attached to the weight draws a wavy line on a rotating drum or digital recorder, creating a seismogram. This record shows the arrival times and strengths of different seismic wave types.
Seismographs detect three main types of seismic waves. Primary waves (P-waves) arrive first because they travel fastest through rock. Secondary waves (S-waves) arrive next and cause more ground shaking. Surface waves arrive last but cause the most damage to buildings and structures. By measuring the time difference between P-wave and S-wave arrivals, scientists can calculate how far away an earthquake occurred. However, one seismograph alone cannot determine the earthquake's location, only its distance.
Networks of seismographs work together to pinpoint an earthquake's epicenter, which is the point on Earth's surface directly above where the earthquake started underground. Scientists need data from at least three seismograph stations to locate an epicenter using a process called triangulation. Each station calculates its distance from the earthquake, and scientists draw circles with those distances as radii around each station on a map. The point where all three circles intersect marks the epicenter location.
Seismograph networks also help scientists determine earthquake magnitude, which measures the energy released during an earthquake. The Richter scale and moment magnitude scale use seismogram wave heights and other data to assign magnitude values. A magnitude 5.0 earthquake releases about 32 times more energy than a magnitude 4.0 earthquake. Modern seismograph networks transmit data in real time to monitoring centers, allowing scientists to issue warnings within seconds of detecting strong shaking.
Scientists use seismograph data to map fault activity and assess earthquake hazards in different regions. Faults are breaks in Earth's crust where earthquakes occur. By recording thousands of small earthquakes over time, scientists identify active fault zones and estimate how often large earthquakes might strike specific areas. This information helps communities develop building codes, emergency plans, and early warning systems. For example, Japan's earthquake early warning system uses a dense network of seismographs to detect P-waves and send alerts to millions of people before the more damaging S-waves and surface waves arrive, giving them precious seconds to take cover.
Modern seismograph technology has advanced significantly from early mechanical instruments. Today's digital seismographs are more sensitive and can detect tiny ground movements from earthquakes thousands of miles away. Global seismograph networks share data instantly via the internet, creating a worldwide earthquake monitoring system. Scientists also use ocean-bottom seismographs to study earthquakes beneath the seafloor and monitor tsunami-generating earthquakes. This comprehensive monitoring helps protect communities and advance our understanding of Earth's dynamic processes.
Interesting Fact: The most sensitive seismographs can detect ground movements smaller than the width of a human hair, allowing scientists to record earthquakes occurring anywhere on Earth.
What does a seismograph detect and record?
Ground motion caused by earthquakesTemperature changes in Earth's coreWind speed during stormsOcean wave heights
Which type of seismic wave arrives first at a seismograph station?
How many seismograph stations are needed to locate an earthquake's epicenter?
One stationTwo stationsAt least three stationsTen stations
What is the epicenter of an earthquake?
The deepest point underground where the earthquake startsThe point on Earth's surface directly above where the earthquake startedThe location of the seismograph stationThe area with the most damage
In the context of the passage, what does 'magnitude' mean?
The distance from the epicenterThe depth of the earthquakeA measurement of the energy released during an earthquakeThe number of aftershocks
What is a 'fault' as described in the passage?
An error in seismograph readingsA break or crack in Earth's crust where earthquakes occurA type of seismic waveA damaged building after an earthquake
Why do scientists use networks of seismographs instead of just one seismograph?
To make the instruments more expensiveTo pinpoint the earthquake's epicenter location using triangulationTo measure temperature changesTo predict weather patterns
How does Japan's earthquake early warning system help protect people?
It stops earthquakes from happeningIt detects P-waves and sends alerts before more damaging waves arriveIt builds stronger buildings automaticallyIt moves people to safe locations
True or False: A magnitude 5.0 earthquake releases about 32 times more energy than a magnitude 4.0 earthquake.
TrueFalse
True or False: Surface waves arrive first but cause the least damage to buildings.
TrueFalse
Who it's for
Perfect for the way you teach
Teachers
Build comprehension skills
Auto-graded quiz
Differentiated reading
Parents
Read together at home
Improve fluency
Quiet reading time
Homeschoolers
Reading curriculum support
Independent practice
Track Lexile growth
Topics
seismographsearthquakesseismic wavesepicentermagnitudefault activityearthquake monitoringNGSS MS-ESS3-2middle school science
Reviews & Ratings
No reviews yet. Be the first to share your experience!
More reading you might love
20 more
Natural Disaster: Earthquake
RI.3.1RI.4.4RI.4.2RI.5.2
FREE
Volcanic Eruptions: Causes, Types, and Key Features
MS-ESS3-2MS-ESS2-2RST.6-8.3
$1.50
Obsidian: The Natural Glass Rock
MS-ESS2-3MS-ESS3-2RST.6-8.4
FREE
Kīlauea Volcano: Hawaii’s Ever-Changing Landscape
MS-ESS3-2MS-ESS2-3RST.6-8.2
FREE
All About Seismometers
MS-ESS3-2MS-ESS2-3RST.6-8.2
FREE
What Is the Difference Between Magma and Lava?
MS-ESS2-3MS-ESS3-2RST.6-8.4
$1.50
Measuring Hurricane Intensity – The Saffir-Simpson Hurricane Wind Scale