Maps and Mapping
Interactive passage with audio narration, comprehension questions, and printable PDF.
What's included
Maps and Mapping preview and details
About this printable Maps and Mapping science reading passage, NGSS-aligned (Grades 5-8)
Sample passage and quiz from Maps and Mapping
Reading passage and comprehension quiz preview
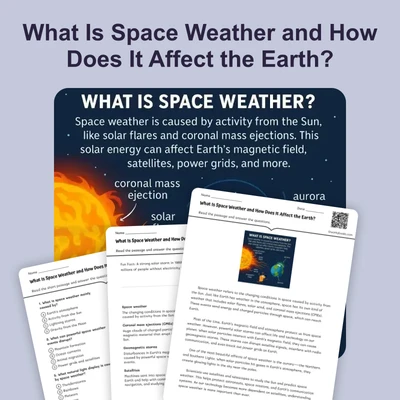
Maps and Mapping

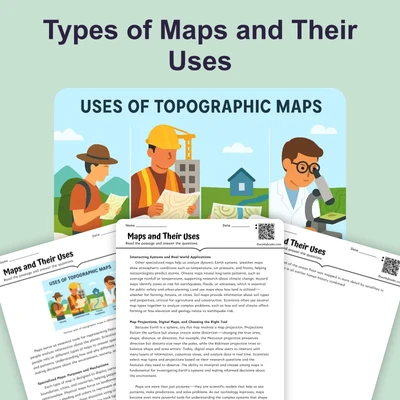
Maps are critical scientific tools that help us understand, analyze, and predict Earth's surface features and processes. Whether studying mountain formation, tracking storms, or planning safe cities, maps provide a visual representation of complex data. Maps support scientific investigations by displaying information about elevation, rock types, weather patterns, ocean depths, and natural hazards. Their use allows scientists to observe patterns and make predictions that improve safety, resource management, and our understanding of the planet.
Types of Maps and Their Mechanisms
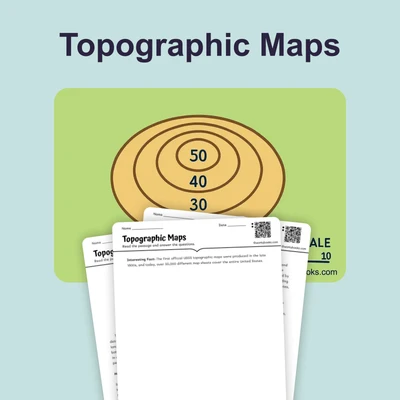
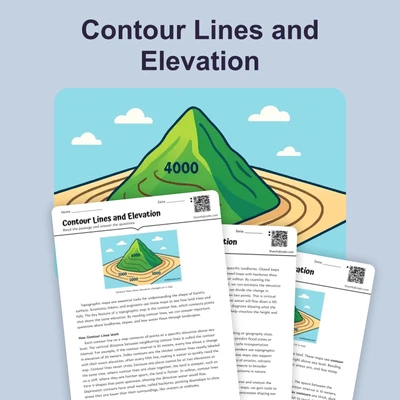
There are many types of maps, each designed for a specific purpose. Topographic maps show elevation and landforms using contour lines, which connect points of equal height. The difference in elevation between contour lines is called the contour interval. Geologic maps display rock types, faults, and folds beneath the surface. Weather maps use symbols to show temperature, pressure, and weather fronts. Bathymetric maps reveal the shape of the ocean floor, using lines similar to those in topographic maps. Hazard maps identify areas at risk for earthquakes, floods, or volcanic eruptions. Each map type uses symbols and colors to represent different data, allowing scientists to quickly interpret information.
Map Elements and Reading Topographic Maps
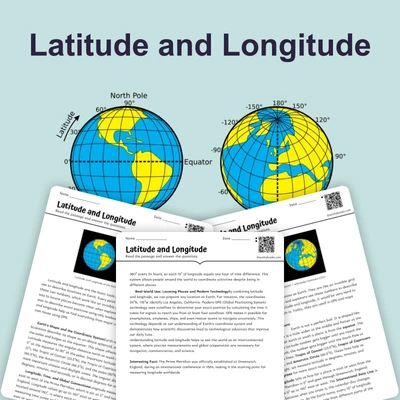
All maps include specific elements to help users understand them. The scale shows the relationship between distances on the map and real distances on Earth. The legend explains the meaning of symbols and colors. The compass rose indicates direction, while coordinates (latitude and longitude) allow precise location of points. Reading topographic maps requires understanding how contour lines show hills, valleys, and slopes. When contour lines are close together, the slope is steep; when lines are far apart, the land is flatter. For example, Mount Everest's summit is located using latitude (27.9881° N) and longitude (86.9250° E), and its topographic map shows tightly packed contour lines due to its steep slopes.
Geographic Information Systems and Scientific Applications
Modern mapping often uses Geographic Information Systems (GIS), which are computer systems for storing, analyzing, and displaying spatial data. GIS lets scientists combine different types of maps, such as geology and rainfall, to analyze patterns and predict future events. For example, GIS can help city planners decide where to build new infrastructure by combining hazard maps, population maps, and transportation data. Scientists also use GIS to track disease outbreaks, study climate change, and protect endangered species. By revealing patterns in data, maps support scientific thinking and problem-solving.
Maps are more than just pictures of places—they are powerful tools that allow scientists and society to make informed decisions about Earth's resources, hazards, and environment. As digital mapping technologies advance, our ability to understand and protect the planet continues to grow.
Interesting Fact:
The oldest known world map dates back over 2,600 years and was carved on a clay tablet in ancient Babylon!
Comprehension quiz (10 questions)
1. What is the main purpose of maps in science?
2. Which type of map would a scientist use to study the shape of the ocean floor?
3. What does the contour interval on a topographic map show?
4. According to the passage, how do hazard maps help people?
5. What does GIS stand for?
6. In the passage, which map element helps you understand what symbols and colors mean?
7. Why are contour lines close together in a topographic map of Mount Everest?
8. How can GIS help city planners?
9. True or False: A map's scale shows direction, like north or south.
10. True or False: Scientists use maps to observe patterns and make predictions.
Perfect for the way you teach
- Build comprehension skills
- Auto-graded quiz
- Differentiated reading
- Read together at home
- Improve fluency
- Quiet reading time
- Reading curriculum support
- Independent practice
- Track Lexile growth