Topographic Maps
Interactive passage with audio narration, comprehension questions, and printable PDF.
What's included
Topographic Maps preview and details
About this printable Topographic Maps science reading passage, NGSS-aligned (Grades 5-8)
Sample passage and quiz from Topographic Maps
Reading passage and comprehension quiz preview
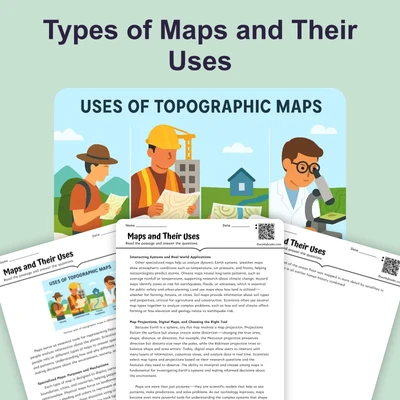
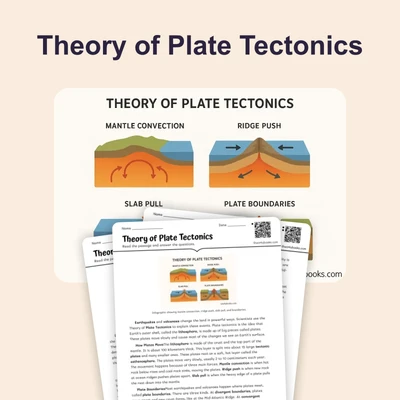
Topographic Maps
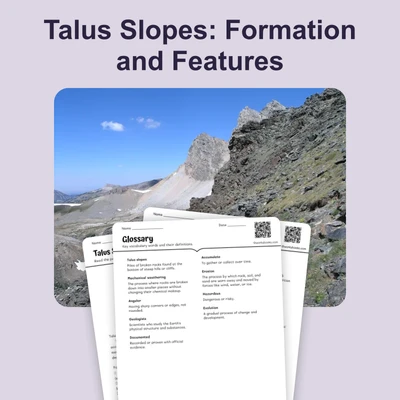
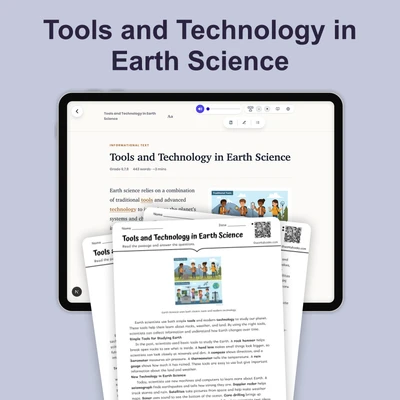
Topographic maps are essential tools for representing the surface of the Earth in detail. Hikers, scientists, and engineers rely on these maps to plan routes, study landforms, and design structures. Unlike simple road maps, topographic maps show both natural and human-made features, and they use contour lines to display changes in elevation. Understanding how to read and interpret topographic maps allows people to visualize the shape of the land and make informed decisions in many fields.
How Topographic Maps Show Elevation and Features
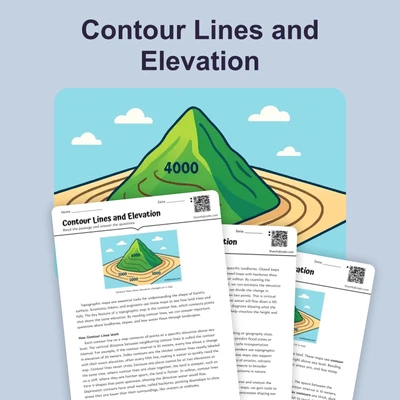
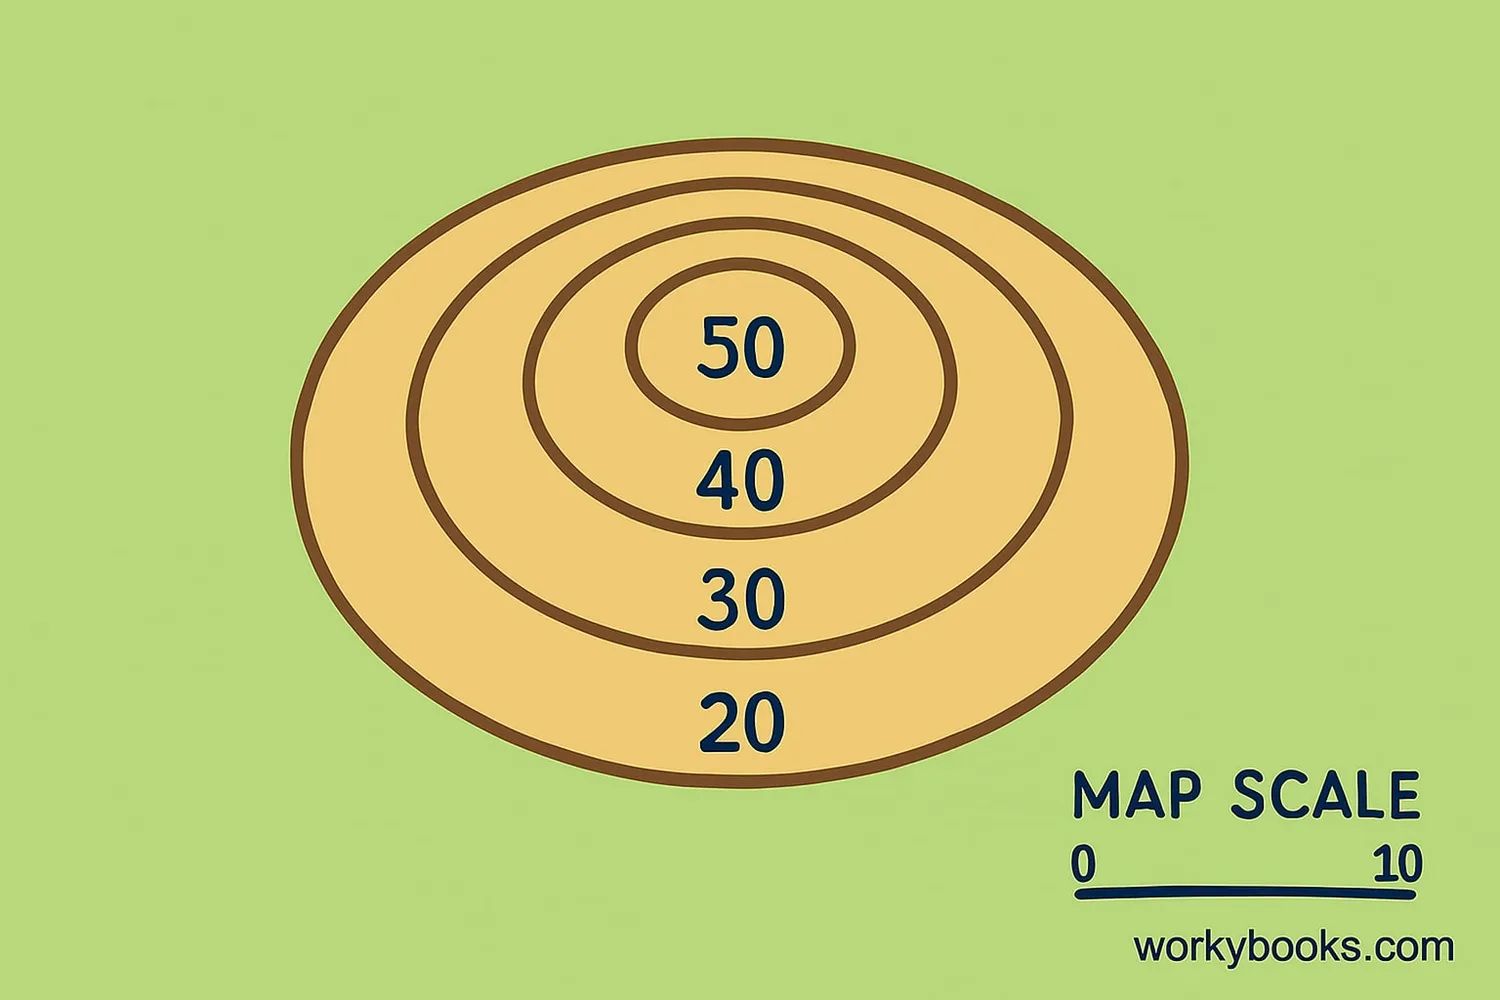
The main mechanism that makes topographic maps effective is the use of contour lines. Each contour line connects points of equal elevation, helping map readers see hills, valleys, and slopes. The contour interval, or the vertical distance between lines, is always given in the map legend, such as 10 or 20 feet. Closely spaced contour lines indicate steep slopes, while widely spaced lines show gentle slopes. Other key elements include the scale (like 1:24,000, meaning one inch on the map equals 24,000 inches in reality), a legend explaining map symbols, a north arrow, and a date showing when the map was made. Symbols represent important features such as buildings, roads, rivers, lakes, forests, and boundaries. Reading these elements together gives a complete picture of the landscape.
Applications and Modern Developments
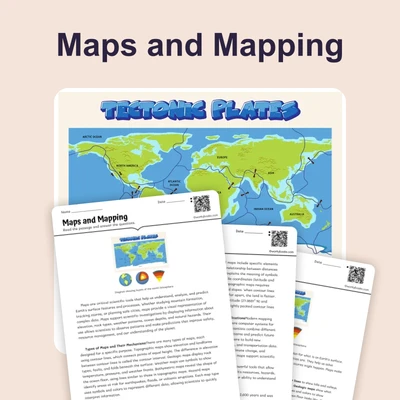
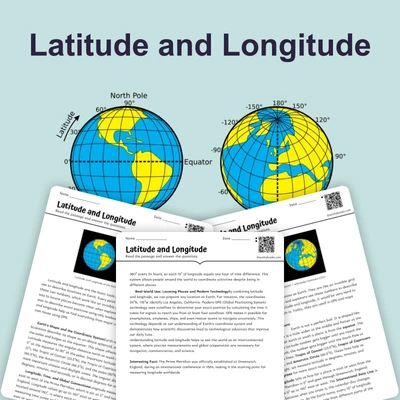
Topographic maps have many real-world uses. Hikers use them to plan safe and efficient routes through unfamiliar terrain, avoiding steep cliffs or finding water sources. Scientists study topographic maps to analyze how landforms are shaped by erosion, weather, or tectonic activity. Engineers consult these maps before building roads, bridges, or dams, since the terrain affects construction. In the United States, the USGS (United States Geological Survey) produces the standard topographic maps, which use grid systems like UTM (Universal Transverse Mercator) and State Plane coordinates for precise location. Today, digital elevation data, such as DEMs (Digital Elevation Models), allow for 3D mapping and computer analysis. Maps and data can be accessed online, through USGS websites, map viewers, and mobile apps, making this information easier to obtain than ever before.
Interpreting and Using Topographic Maps
To use a topographic map, readers must combine information from contour lines, symbols, and the grid system. Planning a hiking route, for example, involves identifying the starting and ending points, noting elevation changes, and finding landmarks like streams or ridges. Understanding the map's scale helps estimate distances, while the legend decodes symbols for features along the way. Scientists may compare maps from different years to study changes in landforms, such as river erosion or landslides. Engineers use contour data to design structures that fit the landscape. Mastering these skills connects map reading with broader scientific practices, such as modeling, data analysis, and problem-solving.
Topographic maps reveal the complex interactions between Earth's surface processes and human activity. By interpreting these maps, we gain insight into both natural and built environments. As technology advances, digital maps and models will continue to improve our understanding of landforms and how we interact with them.
Interesting Fact: The first official USGS topographic maps were produced in the late 1800s, and today, over 55,000 different map sheets cover the entire United States.
Comprehension quiz (10 questions)
1. What is the main purpose of a topographic map?
2. Which map element tells you the meaning of different symbols?
3. What does a closely spaced set of contour lines indicate?
4. How can scientists use topographic maps?
5. In the map scale 1:24,000, what does this mean?
6. What does the term 'DEMs' mean in the passage?
7. Why is it important for engineers to use topographic maps before building roads?
8. Which of the following is NOT typically found on a topographic map?
9. True or False: A grid system like UTM helps users find exact locations on a topographic map.
10. True or False: Digital elevation data has made topographic information easier to access and use.
Perfect for the way you teach
- Build comprehension skills
- Auto-graded quiz
- Differentiated reading
- Read together at home
- Improve fluency
- Quiet reading time
- Reading curriculum support
- Independent practice
- Track Lexile growth