What Are Topographic Maps
Interactive passage with audio narration, comprehension questions, and printable PDF.
What's included
What Are Topographic Maps preview and details
About this printable What Are Topographic Maps science reading passage, NGSS-aligned (Grades 3-5)
Sample passage and quiz from What Are Topographic Maps
Reading passage and comprehension quiz preview
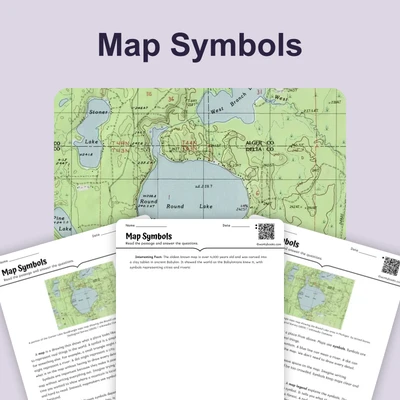
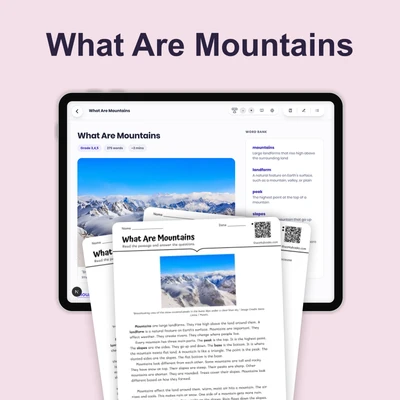
What Are Topographic Maps
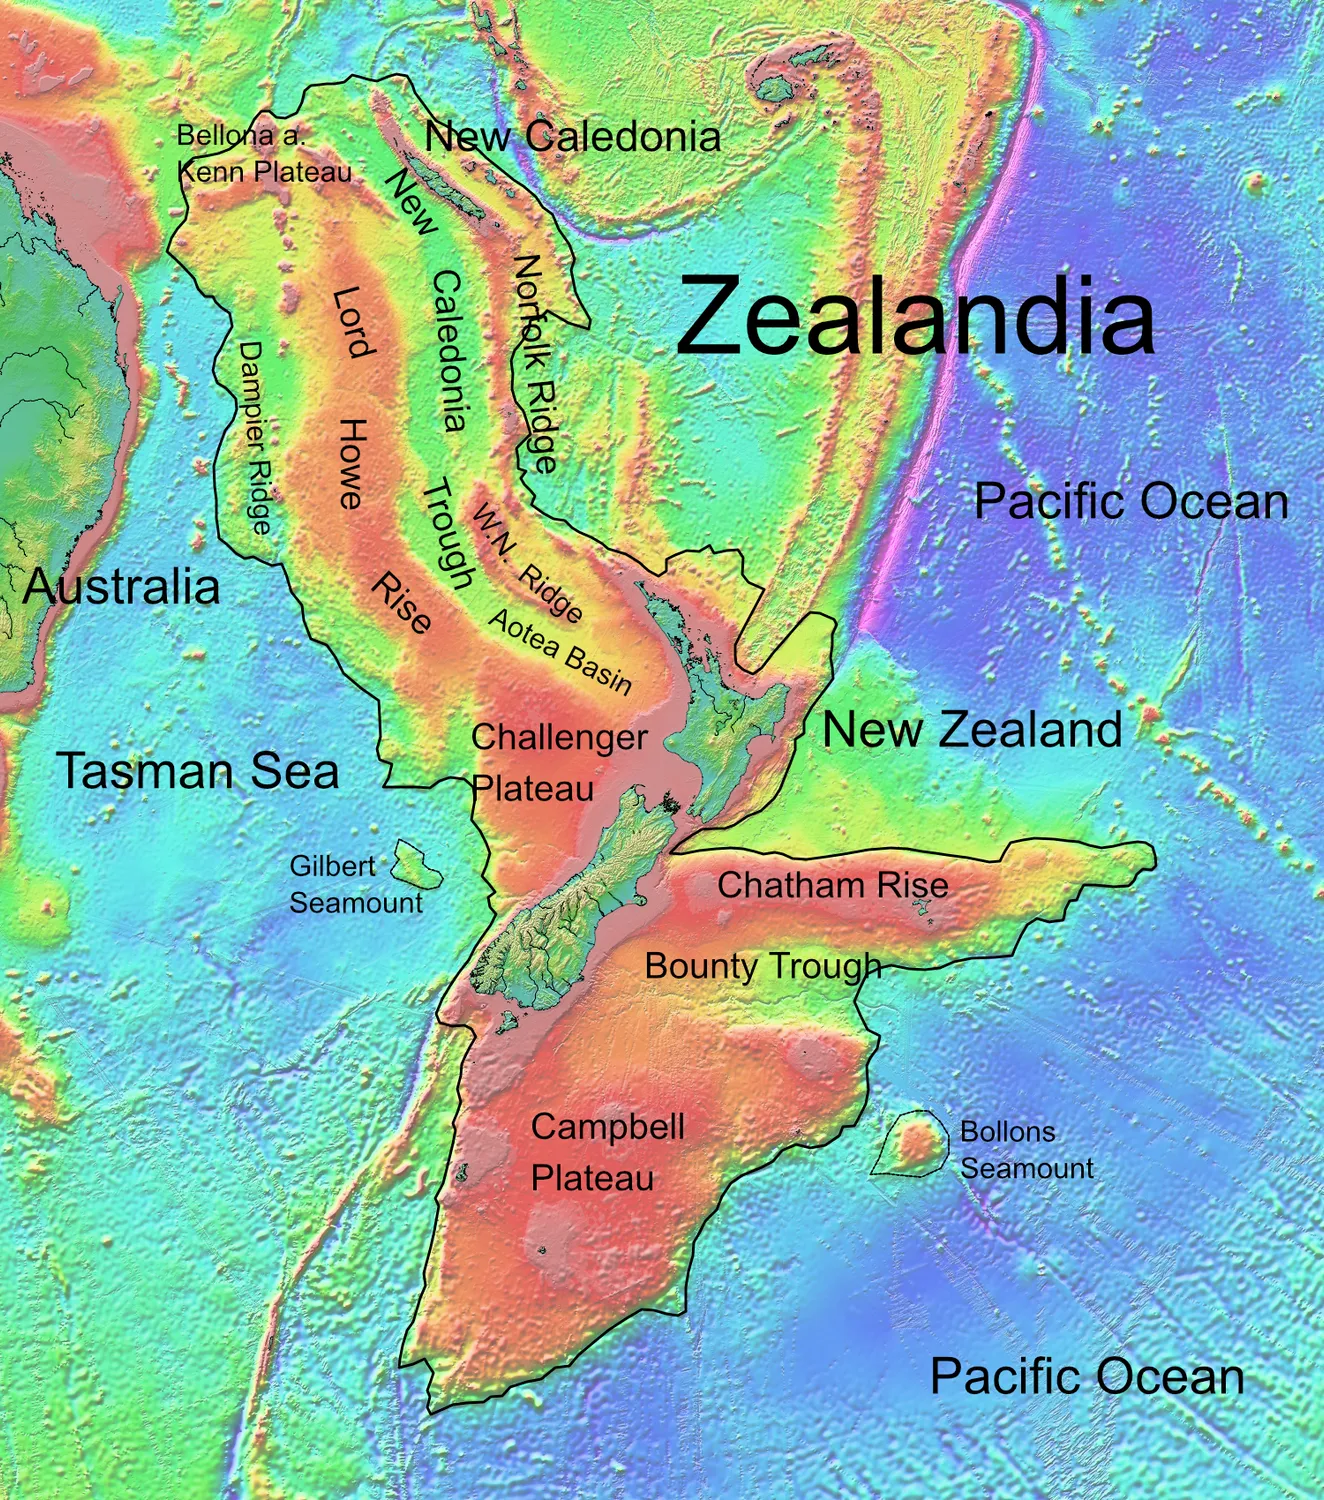
"Zealandia, topographic map" by Ulrich Lange, Bochum, Germany / Wikimedia Commons.
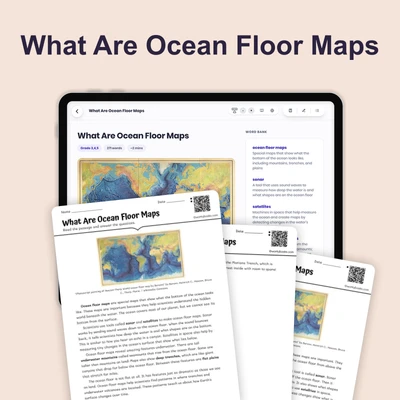
A topographic map is a special kind of map that shows the shape and height of the land. Regular maps show roads, cities, and rivers, but topographic maps also show whether the ground is flat, hilly, or mountainous. These maps help us understand what the land looks like even when we cannot see it in person.
Topographic maps use curved lines called contour lines. Each contour line connects all the points that are at the same height above sea level, which is the level of the ocean's surface. Think of it like the rings you see when you stack plates—each ring is at a different height. When contour lines are close together, the land is steep, like a tall hill or mountain. When the lines are far apart, the land is flat or has a gentle slope, like a field.
Scientists called geologists use topographic maps to study landforms such as valleys, hills, and mountains. Engineers use these maps to decide where to build roads and buildings. City planners look at topographic maps to see if land will flood during heavy rain. These maps turn the three-dimensional world into something we can study on a flat piece of paper.
Interesting Fact: The highest point on Earth is Mount Everest, which rises 29,032 feet above sea level. On a topographic map, you would see hundreds of contour lines packed very close together to show how steep this mountain is!
Comprehension quiz (8 questions)
1. What do topographic maps show?
2. What are contour lines?
3. What does sea level mean?
4. Close contour lines mean steep land.
5. What do geologists study using these maps?
6. Why do engineers use topographic maps?
7. What do far apart lines show?
8. Which word means land at sharp angle?
Perfect for the way you teach
- Build comprehension skills
- Auto-graded quiz
- Differentiated reading
- Read together at home
- Improve fluency
- Quiet reading time
- Reading curriculum support
- Independent practice
- Track Lexile growth