Reading PassagePremium

Where Climate Data Comes From

Interactive passage with audio narration, comprehension questions, and printable PDF.

No ratings yet
Grades 5–8ScienceReadingElaEnglish · SpanishInteractive · Printable
Aligned toMS-ESS3-5
Just this resource
$1.50
One-time purchase
Best value
Unlock everything
$49.99$24.99/yr
50% off until Sept 15 — 10,000+ resources
Renews at $49.99/year.
Unlock above to use these actions

What's included

Reading passage
Audio narration
Comprehension quiz
Writing activity
Glossary & flashcards
Differentiated version
Spanish translation

Where Climate Data Comes From preview and details

About this printable Where Climate Data Comes From science reading passage, NGSS-aligned (Grades 5-8)

This 450-word informational science reading passage explores where climate data comes from for middle school students in grades 6-8. Aligned with NGSS standard MS-ESS3-5, the passage explains how scientists collect climate information from a worldwide network of instruments including land-based weather stations, ocean buoys and ships, atmospheric balloons, and satellites. Students learn how these diverse data sources are combined to calculate global average temperatures and track planetary changes. The passage emphasizes the systems approach to climate science, showing how data from multiple sources are checked against each other to provide accurate information about Earth's entire climate system. Audio-integrated content supports diverse learners while maintaining scientific accuracy and age-appropriate vocabulary. The passage includes real-world examples and connects to broader Earth science concepts about climate monitoring and global environmental changes.
Written by Workybooks TeamPublished by Workybooks
Preview

Sample passage and quiz from Where Climate Data Comes From

Reading passage and comprehension quiz preview

Where Climate Data Comes From
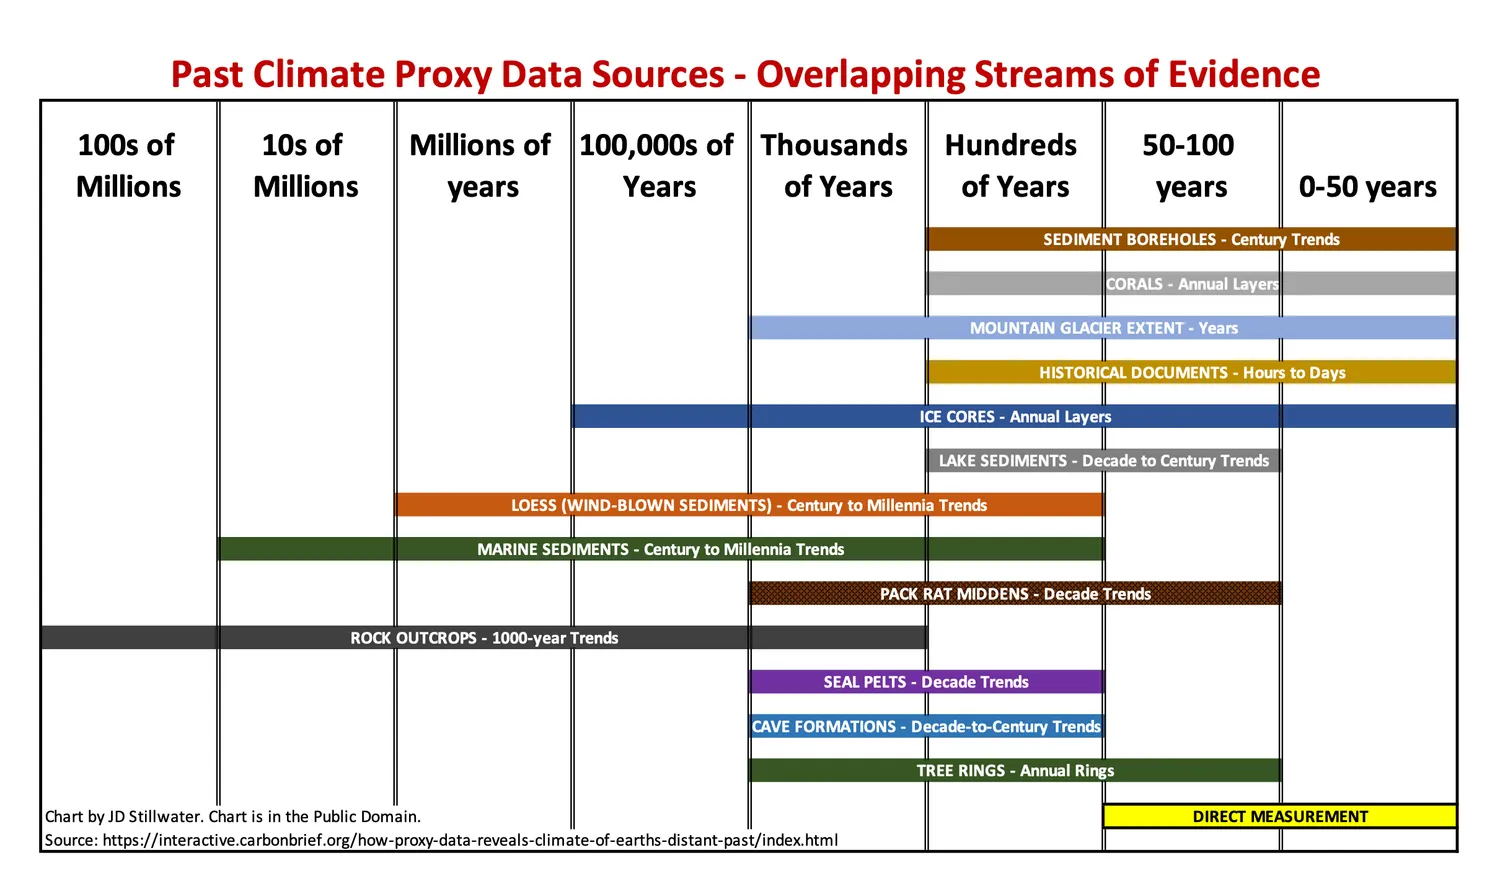
Climate Proxy Data Timeline & Overlap

Using information from carbonbrief.org, the author (Jdstillwater) created this graphic representation of how various lines of evidence overlap. The specific URL at carbonbrief.org is cited in the graphic and here: https://interactive.carbonbrief.org/how-proxy-data-reveals-climate-of-earths-distant-past/index.html  / Wikimedia Commons 

Climate data comes from a worldwide network of instruments that work together. Scientists collect information from thousands of locations on land, in the oceans, throughout the atmosphere, and from space. This global system allows researchers to track changes across the entire planet.

On land, weather stations record temperature, rainfall, wind speed, and humidity. These stations can be found in cities, forests, deserts, and mountains. Some stations have operated for more than a century, providing valuable long-term records. In the oceans, buoys float on the surface and measure water temperature, wave height, and air conditions. Ships also collect data as they travel across the seas. Scientists use weather balloons that rise through the atmosphere twice each day from hundreds of locations. These balloons carry instruments that measure temperature, air pressure, and humidity at different heights.

Satellites orbit Earth and observe the planet from space. They measure sea ice extent, sea level changes, cloud patterns, and land surface temperatures. Satellites can cover areas where ground stations cannot reach, such as remote polar regions and vast ocean areas. Evidence shows that satellite data helps scientists understand changes happening across large regions.

To calculate a global average temperature, scientists carefully combine readings from all these sources. They use mathematical methods to account for differences between land, sea, and air measurements. The data are checked against each other to ensure accuracy. For example, temperature anomalies recorded by satellites can be compared with ground station readings. This cross-checking process helps scientists identify errors and confirm patterns.

The National Oceanic and Atmospheric Administration operates one of the largest climate monitoring networks. Their system includes over 10,000 weather stations on land and more than 100 drifting buoys in the oceans. These instruments send data to central computers where scientists analyze the information. Because data come from everywhere and are verified through multiple sources, researchers can describe climate patterns for the entire planet. This comprehensive approach allows scientists to detect changes that affect the whole Earth, not just individual countries or regions. Understanding where climate data comes from helps us trust the information scientists use to study our changing planet.

Interesting Fact: Weather balloons can rise more than 30 kilometers into the atmosphere before they burst, sending back data throughout their journey that helps scientists understand conditions from ground level to the edge of space.

Comprehension quiz (10 questions)

1. What types of instruments collect climate data on land?

Weather stations that measure temperature, rainfall, wind, and humidity
Only thermometers that measure temperature
Satellites that orbit above the ground
Ocean buoys that float on water

2. How do satellites help scientists study climate?

They only take pictures of clouds
They measure sea ice, sea level, cloud patterns, and land temperatures from space
They collect water samples from the ocean
They send weather balloons into the atmosphere

3. According to the passage, what does 'cross-checking' mean in climate science?

Using only one source of data to confirm information
Ignoring data that doesn't match expectations
Comparing data from different sources to ensure accuracy and identify errors
Collecting data only from satellites

4. What is a 'temperature anomaly' as used in the passage?

The highest temperature ever recorded
The difference between measured temperatures and the long-term average
A mistake in temperature measurement
The temperature inside a weather station

5. Why do scientists combine data from multiple sources to calculate global average temperature?

Because one source is not enough to understand the entire planet's climate
Because satellites cannot measure temperature accurately
Because weather stations only work in cities
Because ocean data is more important than land data

6. How often do weather balloons rise into the atmosphere to collect data?

Once per week
Twice each day
Once per month
Every hour

7. What advantage do satellites have over ground-based weather stations?

They are cheaper to operate
They can cover remote areas like polar regions and vast oceans where ground stations cannot reach
They provide more accurate temperature readings
They last longer than weather stations

8. If a scientist wanted to study ocean temperature changes over a large area, which combination of tools would be most useful?

Only weather balloons
Weather stations on nearby land
Ocean buoys, ships, and satellites working together
Only satellites

9. True or False: Some weather stations have been collecting data for over 100 years.

True
False

10. True or False: Climate data comes from only one country's monitoring system.

True
False
Who it's for

Perfect for the way you teach

Teachers
  • Build comprehension skills
  • Auto-graded quiz
  • Differentiated reading
Parents
  • Read together at home
  • Improve fluency
  • Quiet reading time
Homeschoolers
  • Reading curriculum support
  • Independent practice
  • Track Lexile growth
Topics

Reviews & Ratings

No reviews yet. Be the first to share your experience!

More reading you might love

20 more
Passage
Natural Disaster: Hurricanes - reading educational content
Grades 4–5

Natural Disaster: Hurricanes

weather and climate · RI.3.1

Free
Passage
Animal Migration and Climate Change - reading educational content
Grades 5–8

Animal Migration and Climate Change

weather and climate · MS-LS2-4

$1.50
Passage
What Is Global Warming? - reading educational content
Grades 5–8

What Is Global Warming?

weather and climate · MS-ESS3-5

Free
Passage
How to Stop Global Warming - reading educational content
Grades 5–8

How to Stop Global Warming

weather and climate · MS-ESS3-5

$1.50
Passage
What Is Ocean Acidification - reading educational content
Grades 5–8

What Is Ocean Acidification

weather and climate · MS-ESS3-5

$1.50
Passage
Human Impacts: Climate Change - reading educational content
Grades 5–8

Human Impacts: Climate Change

life science · MS-LS2-4

$1.50
Passage
Climate Change: Vulnerable Ecosystems - reading educational content
Grades 5–8

Climate Change: Vulnerable Ecosystems

life science · MS-ESS3-5

$1.50
Passage
Climate Change: Solutions and Mitigation - reading educational content
Grades 5–8

Climate Change: Solutions and Mitigation

life science · MS-ESS3-4

$1.50
Passage
Scientific Inquiry in Earth Science - reading educational content
Grades 5–8

Scientific Inquiry in Earth Science

earth and space science · MS-ESS1-4

$1.50
Passage
The Great Barrier Reef - reading educational content
Grades 5–8

The Great Barrier Reef

life science · MS-LS2-1

$1.50
Passage
The Siberian Taiga - reading educational content
Grades 5–8

The Siberian Taiga

life science · MS-LS2-1

$1.50
Passage
Melting Glaciers and Ice Sheets - reading educational content
Grades 5–8

Melting Glaciers and Ice Sheets

weather and climate · MS-ESS3-5

$1.50
Passage
Sea Level Rise and Climate Change - reading educational content
Grades 5–8

Sea Level Rise and Climate Change

weather and climate · MS-ESS3-5

$1.50
Passage
What Ice Cores Reveal - reading educational content
Grades 5–8

What Ice Cores Reveal

weather and climate · MS-ESS3-5

$1.50
Passage
How Climate Change Affects Weather - reading educational content
Grades 5–8

How Climate Change Affects Weather

weather and climate · MS-ESS3-5

$1.50
Passage
How Climate Change Affects Oceans - reading educational content
Grades 5–8

How Climate Change Affects Oceans

weather and climate · MS-ESS3-5

$1.50
Passage
Carbon Footprint - reading educational content
Grades 5–8

Carbon Footprint

science · MS-ESS3-4

$1.50
Passage
El Niño - reading educational content
Grades 5–8

El Niño

weather and climate · MS-ESS2-6

$1.50
Passage
ENSO and Global Climate - reading educational content
Grades 5–8

ENSO and Global Climate

weather and climate · MS-ESS2-6

$1.50
Passage
Natural Climate Variability - reading educational content
Grades 5–8

Natural Climate Variability

weather and climate · MS-ESS2-6

$1.50
Copyright © 2026 Workybooks. Made with ♥ in California.