What Exponential Population Growth Looks Like
Interactive passage with audio narration, comprehension questions, and printable PDF.
By completing this purchase you agree to our Terms of Use and Privacy Policy. Your subscription renews automatically until you cancel. You can cancel anytime from your account settings. All sales are final and non-refundable. Digital content is available for download in your account immediately upon purchase.
What's included
What Exponential Population Growth Looks Like preview and details
About this printable What Exponential Population Growth Looks Like science reading passage, NGSS-aligned (Grades 6-8)
Sample passage and quiz from What Exponential Population Growth Looks Like
Reading passage and comprehension quiz preview
What Exponential Growth Looks Like
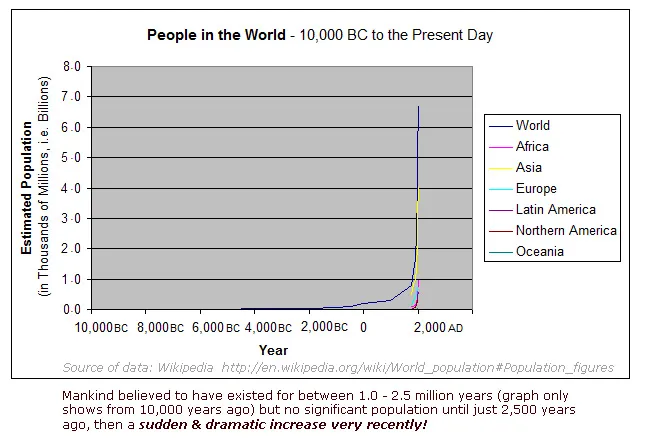
Note: (a) Minimal population for over 1 million years of human history (only last 10,000 years shown on graph). (b) Steady growth began around 500BC. (c) Growth accelerated noticeably from around 1000AD onwards (d) yet faster growth from around 1800AD. (e)Exponential growth since 1950 to the present day with even more forecast! "Population-since-10000BC-" by BS / Wikimedia Commons
Exponential growth is a pattern where a population increases by multiplying rather than adding the same amount each time. When something grows exponentially, it doubles or triples over regular time periods. This type of growth starts slowly but then increases rapidly. In contrast, linear growth adds the same amount during each time period, creating a steady, predictable pattern. Understanding the difference between these two growth patterns helps scientists predict how populations will change and what resources they will need.
To understand exponential growth, think about a multiplication factor. If a population has 100 individuals and grows by a multiplication factor of 2 each year, it will have 200 individuals after one year, 400 after two years, and 800 after three years. The population keeps doubling. With linear growth using the same starting number, if 100 individuals are added each year, the population would be 200 after one year, 300 after two years, and 400 after three years. The difference becomes enormous over time. After ten years, exponential growth with a factor of 2 produces 102,400 individuals, while linear growth produces only 1,100 individuals.
Human population growth provides a clear real-world example of exponential growth. For most of human history, population grew slowly and linearly. Around the year 1800, Earth had about 1 billion people. By 1930, the population had doubled to 2 billion. This doubling took 130 years. However, the next doubling to 4 billion took only 44 years, happening in 1974. The doubling time kept decreasing, showing exponential growth. Today, Earth's population exceeds 8 billion people. Scientists use population data from censuses and records to track these changes and create graphs that show the exponential curve.
Graphs help visualize the difference between linear and exponential growth patterns. A linear growth graph shows a straight line going upward at a constant angle. An exponential growth graph shows a curve that starts nearly flat and then rises steeply, creating a J-shaped pattern. When you plot human population over the last 2,000 years, the graph stays relatively flat until around 1800, then shoots upward dramatically. This visual representation makes it clear that population growth has shifted from linear to exponential.
Exponential population growth creates challenges for resource demand. Every person needs food, water, shelter, and energy. When population doubles, resource needs also double. With exponential growth, demand for resources increases faster than many natural systems can supply them. For example, if a region's population grows from 1 million to 2 million people in 20 years, farmers must produce twice as much food, water systems must supply twice as much clean water, and energy production must double. These doubling demands put pressure on natural resources like forests, freshwater, and fossil fuels. Scientists study these patterns to help communities plan for sustainable futures.
Understanding exponential growth helps explain why environmental concerns have increased in recent decades. The rapid rise in human population means rapid increases in carbon dioxide emissions, plastic waste, and habitat destruction. A population growing linearly would add the same environmental impact each year. An exponentially growing population multiplies its impact, making environmental problems accelerate. Recognizing this pattern is the first step toward developing solutions that can meet human needs while protecting Earth's carrying capacity, which is the maximum population an environment can support sustainably.
Interesting Fact: If a population continues to grow exponentially with a 2% annual growth rate, it will double in just 35 years, but if growth slows to 1% per year, doubling takes 70 years.
Comprehension quiz (10 questions)
1. What is exponential growth?
2. If a population of 100 doubles each year, how many individuals will there be after 3 years?
3. What does the term 'doubling time' mean?
4. How long did it take for human population to double from 1 billion to 2 billion?
5. What shape does an exponential growth graph make?
6. Why does exponential population growth create challenges for resource demand?
7. What is carrying capacity?
8. How does exponential growth differ from linear growth over ten years if both start with 100 individuals?
9. True or False: Linear growth adds the same amount during each time period.
10. True or False: Human population growth has always been exponential throughout history.
Perfect for the way you teach
- Build comprehension skills
- Auto-graded quiz
- Differentiated reading
- Read together at home
- Improve fluency
- Quiet reading time
- Reading curriculum support
- Independent practice
- Track Lexile growth